The above frequency chart shows the frequency distribution of marks obtained…
GATE · 2022 · BT · General AptitudeGATE · 2022 · EY · General AptitudeGATE · 2022 · PH · General AptitudeGATE · 2022 · CE · Set 1 · General Aptitude
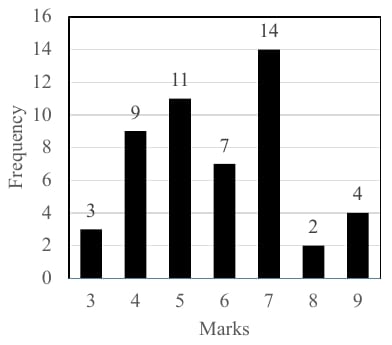
The above frequency chart shows the frequency distribution of marks obtained by a set of students in an exam.
From the data presented above, which one of the following is CORRECT?
- A.
mean > mode > median
- B.
mode > median > mean
- C.
mode > mean > median
- D.
median > mode > mean
Attempted by 1 students.
Sign up free to check your answer
Sign up freeLoading lesson…