Which one of the following options represents the given graph?

GATE · 2023 · EE · General AptitudeGATE · 2023 · ES · General AptitudeGATE · 2023 · XH · General Aptitude

Which one of the following options represents the given graph?
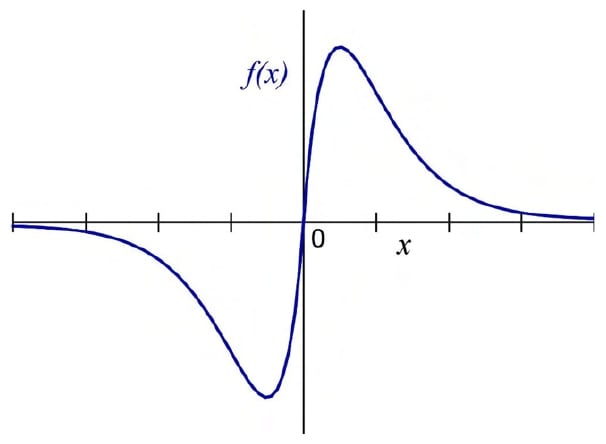
A blue curve on black horizontal and vertical axes. The horizontal axis is labelled x, the function is labelled f(x), and 0 is printed beside the axes intersection. The curve passes through that origin, with a negative trough to its left and a positive peak to its right. The displayed left tail is below and close to the horizontal axis, while the displayed right tail is above and close to it. The horizontal axis has unnumbered ticks on both sides; no numerical tick values or formula are printed.
  1. A.

    f(x)=x22−∣x∣f(x)=x^{2}2^{-|x|}

  2. B.

    f(x)=x 2−∣x∣f(x)=x\,2^{-|x|}

  3. C.

    f(x)=∣x∣2−xf(x)=|x|2^{-x}

  4. D.

    f(x)=x 2−xf(x)=x\,2^{-x}

Attempted by 1 students.

Sign up free to check your answer

Sign up free

Explore the full course: Aptitude For Gate

Loading lesson…