

Range, Mean Deviation, Variance and Standard Deviation: 12 Questions with Solutions
Practise 12 questions on dispersion, from finding a range to recovering a missing number. Each solution shows the calculation and the trap to avoid.
KnowledgeGate Team
Exam prep & CS education
Updated 2 Nov 20267 min read
Confusing absolute deviations with squared deviations can spoil an otherwise correct calculation, and adding a constant can tempt you to change the standard deviation. These 12 questions show the working behind each answer. Attempt the options before reading each solution; write down your formula. For a broader study plan, use the placement preparation category as optional context.
Range questions: find the endpoints before calculating
Range uses the largest and smallest observations. Keep the original unit: ages in years give a range in years.
Q1. Identify the measure of spread
The difference between the maximum and minimum observations is called
(a) frequency
(b) class size
(c) range
(d) mean
Answer: (c), range. The formula is R = maximum - minimum. In a worked illustration with 4, 7, 9, the range is 9 - 4 = 5.
Frequency counts occurrences; the mean here is (4 + 7 + 9)/3 = 20/3.
Q2. Range of an unsorted list of ages
The age of the labourers working in a factory in years is as follows:
31, 41, 28, 54, 34, 27, 23, 33, 35, 42.
The range of their age is
(a) 31 years
(b) 35 years
(c) 23 years
(d) 20 years
Answer: (a), 31 years. Scan all ten observations: the minimum is 23 and the maximum is 54. Therefore, R = 54 - 23 = 31 years.
Do not use the first and last entries, 31 and 42. Revisit the range calculation.
Mean deviation questions: average the absolute distances
Mean deviation requires a named centre. Both answers use the arithmetic mean: MD = sum|x - mu|/n. Absolute values prevent cancellation.
Q3. Mean deviation of ten observations
What is the mean deviation of the data 8, 9, 12, 15, 16, 20, 24, 30, 32, 34?
(a) 10.2
(b) 9.6
(c) 8
(d) 0
Answer: (c), 8. The sum is 200, so mu = 200/10 = 20. Their absolute deviations, in the given order, are:
12, 11, 8, 5, 4, 0, 4, 10, 12, 14.
These sum to 80. Hence MD = 80/10 = 8.
Use the mean as centre. The median, (16 + 20)/2 = 18, gives the same result here.
Q4. Absolute deviations versus signed deviations
Find the mean deviation of 10, 9, 21, 16, 24.
(a) 5.2
(b) 5.1
(c) 5.3
(d) 5.5
Answer: (a), 5.2. The sum is 10 + 9 + 21 + 16 + 24 = 80, giving mu = 80/5 = 16.
Signed deviations are -6, -7, 5, 0, 8. Taking absolute values gives 6, 7, 5, 0, 8, whose sum is 26. Thus MD = 26/5 = 5.2. The signed sum is zero, but that is not the mean deviation. The median is also 16.
For more mean deviation practice beyond these two questions, continue in the statistics module hub.
Variance questions: why squares cannot average to a negative number
For a population, variance is the sum of (x - mean)^2 divided by n, and standard deviation is the square root of variance. The sample estimator uses deviations about the sample mean and divisor n - 1. Here, use population variance.
Q5. Variance written using expectation
If E[X^2] - (E[X])^2 is denoted by R, then
(a) (R = 0)
(b) (R < 0)
(c) (R >= 0)
(d) (R > 0)
Answer: (c). Assuming a finite second moment, R = E[X^2] - (E[X])^2 = E[(X - mu)^2] >= 0.
A constant X = 3 gives R = 9 - 9 = 0, ruling out strict positivity. For equally likely values 1 and 3, E[X^2] = (1 + 9)/2 = 5 and E[X] = 2, so R = 5 - 4 = 1. Refresh these ideas with probability and expectation.
Q6. Variance of consecutive natural numbers
The variance of first n natural numbers is -
(a) (n + 1) / 2
(b) (n + 1)^2 / 12
(c) (2n^2 - 1) / 8
(d) (n^2 - 1) / 12
Answer: (d), (n^2 - 1)/12. With equal weights on 1 through n, mu = (n + 1)/2 and E[X^2] = (n + 1)(2n + 1)/6.
Subtract mu^2:
sigma^2 = (n + 1)(2n + 1)/6 - (n + 1)^2/4
= (n + 1)[2(2n + 1) - 3(n + 1)]/12
= (n + 1)(n - 1)/12 = (n^2 - 1)/12.
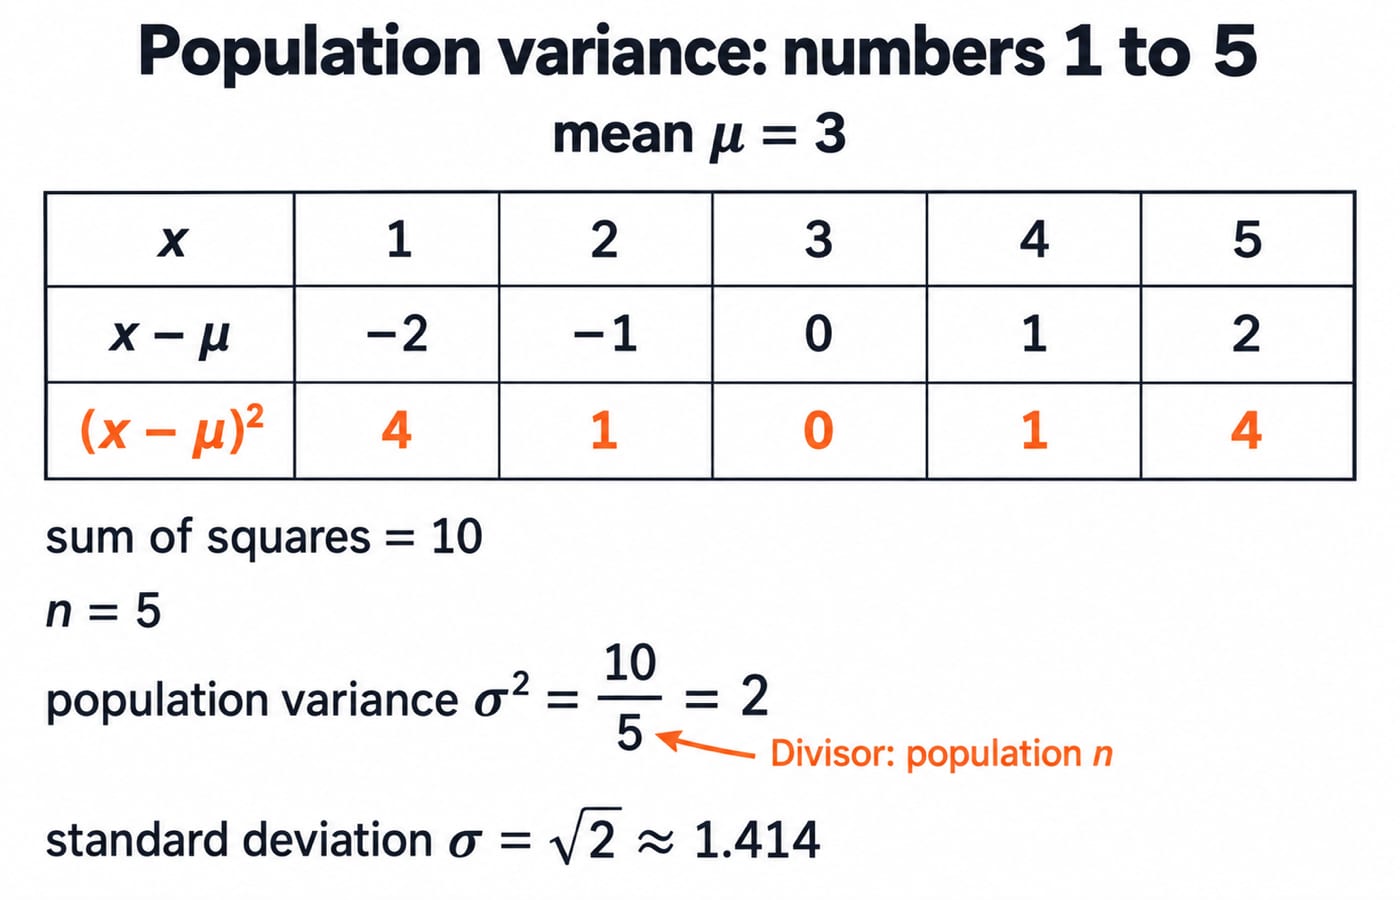
Check n = 5: mean 3; squared deviations 4, 1, 0, 1, 4; sum 10. Population variance is 10/5 = 2 and SD is the square root of 2, about 1.414. Sample variance would be 10/4 = 2.5. Review the variance of the first n natural numbers.
Standard deviation after adding a constant
Adding a constant changes location, while deviations stay fixed: (x + b) - (mu + b) = x - mu.
Q7. Adding 10 to every observation
The standard deviation of the set of numbers 1, 4, 5, 7, 8, 10, 12, 13, 15, 17 is 4.85. If 10 is added to each number, then the standard deviation of the new set is
(a) 48.50
(b) 4.85
(c) 0.485
(d) None of these
Answer: (b), 4.85. The mean shifts from 9.2 to 19.2, but deviations stay unchanged. SD remains 4.85.
The sum of squares is 1082. Population variance is 1082/10 - 9.2^2 = 108.2 - 84.64 = 23.56; the square root of 23.56, about 4.85, matching the stated value.
Q8. Moving a symmetric set to a new centre
If the standard deviation of the observation -5, -4, -3, -2, -1, 0, 1, 2, 3, 4, 5 is the square root of 10, then the standard deviation of the observation 15, 16, 17, 18, 19, 20, 21, 22, 23, 24, 25 will be:
(a) the square root of 10
(b) the square root of 10 + 10
(c) the square root of 10 + 20
(d) None of the options
Answer: (a), the square root of 10. Each value increases by 20. The mean moves from 0 to 20; deviations remain -5 through 5.
Their squared sum is 2(1 + 4 + 9 + 16 + 25) = 110. Variance is 110/11 = 10 and SD is the square root of 10 for both sets.
Scaling and reverse variance calculations
Read INCORRECT carefully in Q9; recover the sum of squares first in Q10.
Q9. Scaling and shifting a sequence
Let X = [x1, x2, ..., xn] have mean mu_x and standard deviation sigma_x. Define y_i = a x_i + b, where a and b are positive constants, and let Y have mean mu_y and standard deviation sigma_y.
Which one of the following statements is INCORRECT?
(a) The mode occurs at the same index in X and Y
(b) The median occurs at the same index in X and Y
(c) mu_y = a mu_x + b
(d) sigma_y = a sigma_x + b
Answer: (d), the incorrect statement. For a > 0, mu_y = a mu_x + b, variance(Y) = a^2 variance(X), and sigma_y = a sigma_x. The offset b cancels from deviations. Positive scaling preserves ordering and equality, including modal and median positions with consistent handling of ties.
Worked illustration: X = 1, 3, a = 2, b = 5 gives Y = 7, 11. Means are 2 and 9; population SDs are 1 and 2. Option (d) wrongly predicts 2 x 1 + 5 = 7. Recheck the effect of scaling and shifting.
Q10. Recover a missing positive number
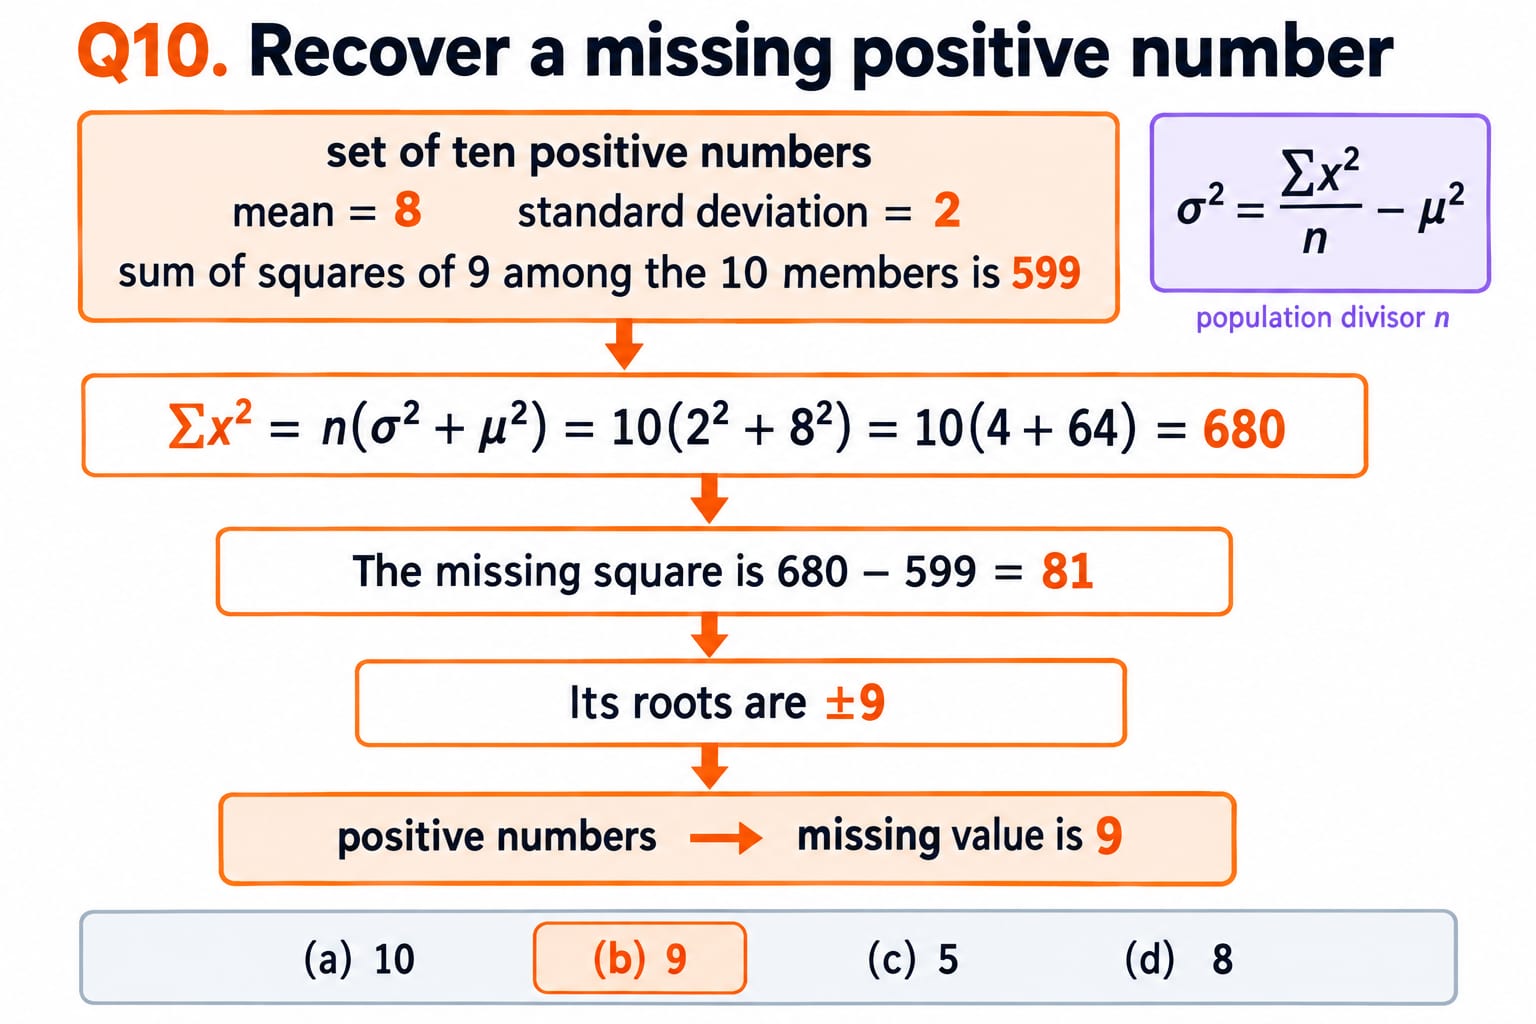
The mean and the standard deviation of a data which is comprised of a set of ten positive numbers are 8 and 2 respectively. If the sum of squares of 9 among the 10 members is 599, what is the 10th number.
(a) 10
(b) 9
(c) 5
(d) 8
Answer: (b), 9. Use the population identity sigma^2 = (sum x^2)/n - mu^2. Rearranging gives:
sum x^2 = n(sigma^2 + mu^2) = 10(2^2 + 8^2) = 10(4 + 64) = 680.
The missing square is 680 - 599 = 81. Its roots are +/-9, but the question specifies positive numbers, so the missing value is 9. The missing-number solution uses population divisor n.
Interpret standard deviation through z-scores and CV
A z-score describes one observation; CV describes relative dispersion of a series.
Q11. Interpret a z-score
The z-score tells you
(a) How far a data point is from the Mean in terms of Standard deviations
(b) The percentage of values greater than the Mean
(c) The likelihood of a certain outcome
(d) The average deviation of all data points
Answer: (a). For sigma > 0, z = (x - mu)/sigma. Worked illustration: x = 70, mu = 60, sigma = 5 gives z = (70 - 60)/5 = 2.
This means two standard deviations above the mean, a signed distance rather than a percentage or probability.
Q12. Compare relative dispersion
The Coefficient of variation is calculated as
(a) (Mean / Standard deviation) * 100
(b) (Standard deviation / Mean) * 100
(c) (Standard deviation / Variance) * 100
(d) (Variance / Standard deviation) * 100
Answer: (b). CV = (standard deviation/mean) x 100 for positive-mean, ratio-scale comparisons.
Worked illustration: series A has mean 50 and SD 5, so CV = (5/50) x 100 = 10%. Series B has mean 100 and SD 8, giving (8/100) x 100 = 8%.
B has lower relative dispersion despite its larger raw SD. Avoid CV for zero means or arbitrary-origin scales.
Check your errors, then choose the next practice step
Range uses endpoints. Mean deviation averages absolute distances from a named centre. Variance averages squared deviations, so its unit is squared; standard deviation takes the square root and restores the original unit.
Redo Q4, Q6 and Q10 without the solutions. Label errors as centre, divisor, transformation or arithmetic, then correct that step before trying another question.
For a structured next step, explore Aptitude for Placement. Use your error labels to choose the concepts to revisit.
Go deeper with the full courseDiscrete Mathematics
Keep learning

Descriptive Statistics for ML: Mean, Variance, IQR and Robust Summaries
Work through one seven-value feature to see how ordinary and robust summaries react to a long right tail. Then turn the results into careful preprocessing choices.
Updated 11 Nov 20266 min readML & Data Science

Singly Linked List MCQs: 12 Solved Questions on Basics and Operations
Solve 12 singly linked list questions step by step, then use the trap list and complexity table to revise the operations that cause the most mistakes.
Updated 17 Sep 20268 min read51 viewsData Structures MCQs
Function Basics MCQs: 12 Solved Questions on Domain, Range and Function Counting
Solve 12 function basics MCQs step by step, from identifying domains and ranges to counting total and partial functions and testing image identities.
Updated 30 Oct 20268 min readDiscrete Mathematics MCQs

Random Variables and Distributions for GATE CS: Expectation and Variance Numericals Solved
Compute expectation and variance from a PMF, recognise four standard distributions, and use linearity and variance scaling without silent formula errors.
Updated 8 Sep 20265 min read83 viewsGATE Strategy & Roadmap