Data Interpretation for Competitive Exams: Concepts, Shortcuts and 4 Solved Sets
Learn a repeatable way to read Data Interpretation sets, choose the correct base, calculate efficiently, and check your answer. Four worked sets cover table, bar, pie and line data.
KnowledgeGate Team
Exam prep & CS education
Updated 23 Sep 20266 min read
Data Interpretation is rarely difficult because of advanced mathematics. Time is lost when a chart is misread, the comparison base is wrong, or an unnecessary calculation is attempted. Tables, bar charts, pie charts, line graphs and caselets all reward the same discipline: read labels and units, fix the base, choose the operation and estimate before exact calculation.
Data Interpretation concepts: what every chart is asking you to do
Data Interpretation, or DI, converts presented data into comparisons, totals, proportions, changes, or averages. Use this four-step loop:
Read the title, labels, and units.
Identify the denominator or comparison base.
Choose the required operation.
Estimate the likely result before calculating exactly.
Tables support exact lookup, bar charts compare categories, and line graphs show change across an ordered axis. Pie charts show part-to-whole shares. Caselets embed data in prose, so build a small table first. These skills sit within the wider Aptitude Courses for Exams & Placements track.
What the question asks | Operation |
|---|---|
Share of a total | part / whole x 100 |
Percentage change | (new - old) / old x 100 |
Average | total / count |
Weighted average | sum(value x weight) / sum(weights) |
Pie-chart angle | part / whole x 360 |
In percentage-change questions, the old value is the base, not the new value.
Data Interpretation shortcuts: fractions, comparison and safe approximation
Memorise 1/2 = 50%, 1/3 = 33.33%, 1/4 = 25%, 1/5 = 20%, 1/6 = 16.67%, 1/8 = 12.5%, 2/3 = 66.67%, and 3/4 = 75%. Use recognition only when the ratio reduces to one of these forms.
Three dependable shortcuts save time:
Cancel common factors before multiplying.
Compare a/b and c/d through the cross-products ad and bc.
Combine successive changes with a + b + ab/100, keeping decreases negative.
Do not add successive percentage changes directly because the base changes. If 398 rises to 462, the increase is 462 - 398 = 64, and the exact change is 64/398 x 100 = 16.08%. Using 400 temporarily as the denominator gives about 16%. Approximate only when options are well separated; calculate exactly for close options.
Solved Data Interpretation set 1: a table, totals and percentage share
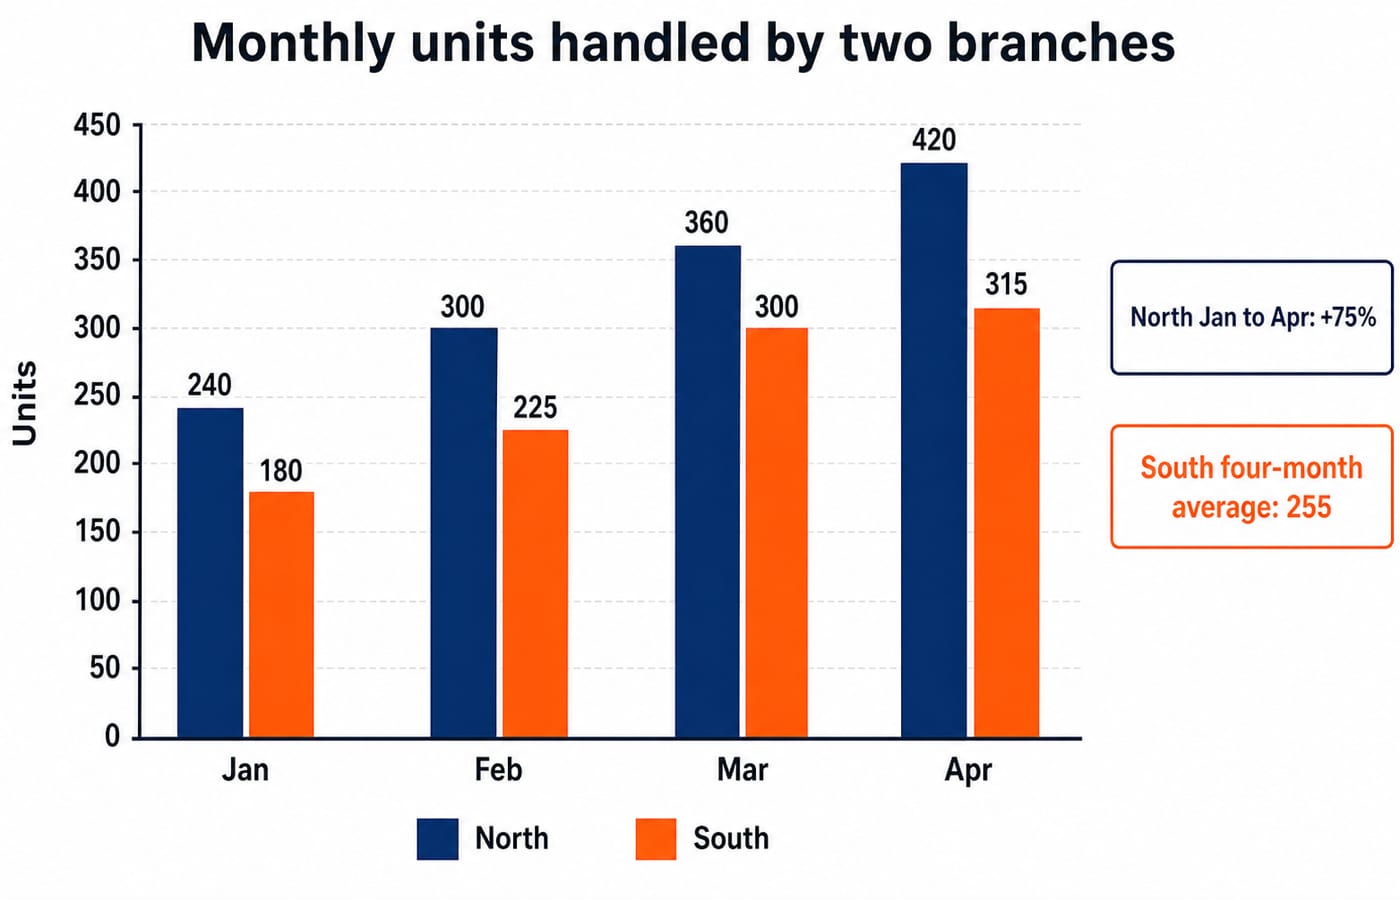
A compact four-month table makes the same totals reusable across increase, average, ratio and share calculations.
Month | North | South |
|---|---|---|
Jan | 240 | 180 |
Feb | 300 | 225 |
Mar | 360 | 300 |
Apr | 420 | 315 |
1. North's January-to-April increase
Increase = 420 - 240 = 180. Percentage increase = 180/240 x 100 = 75%.
2. South's four-month average
Total = 180 + 225 + 300 + 315 = 1,020. Average = 1,020/4 = 255 units.
3. Total North : total South
North = 240 + 300 + 360 + 420 = 1,320. South = 1,020. Thus, 1,320 : 1,020 = 22 : 17 after division by 60.
4. South's share of March
March total = 360 + 300 = 660. South's share = 300/660 x 100 = 45.45%.
Calculate totals once in a margin table and reuse them, but never assume that a visible trend makes every ratio constant.
Solved Data Interpretation set 2: a bar chart comparing two students
The grouped-bar data compare Arun and Beena across Quant, Reasoning and Verbal. Side-by-side bars support category comparisons; stacked bars instead encode segments within a total.
Section | Arun | Beena |
|---|---|---|
Quant | 42 | 36 |
Reasoning | 48 | 40 |
Verbal | 30 | 44 |
1. Who leads overall?
Arun's total = 42 + 48 + 30 = 120. Beena's total = 36 + 40 + 44 = 120. Neither student leads overall.
2. What is Arun's Quant-to-Verbal ratio?
Quant : Verbal = 42 : 30 = 7 : 5.
3. By what percentage is Beena's Verbal score more than Arun's?
Lead = 44 - 30 = 14. Percentage lead = 14/30 x 100 = 46.67%, using Arun's smaller score of 30 as the base, since the value after “than” is the base.
4. By what percentage is Arun's Reasoning score more than Beena's?
Lead = 48 - 40 = 8. Percentage lead = 8/40 x 100 = 20%, using Beena's 40 as the base.
Solved Data Interpretation set 3: converting a pie chart to counts
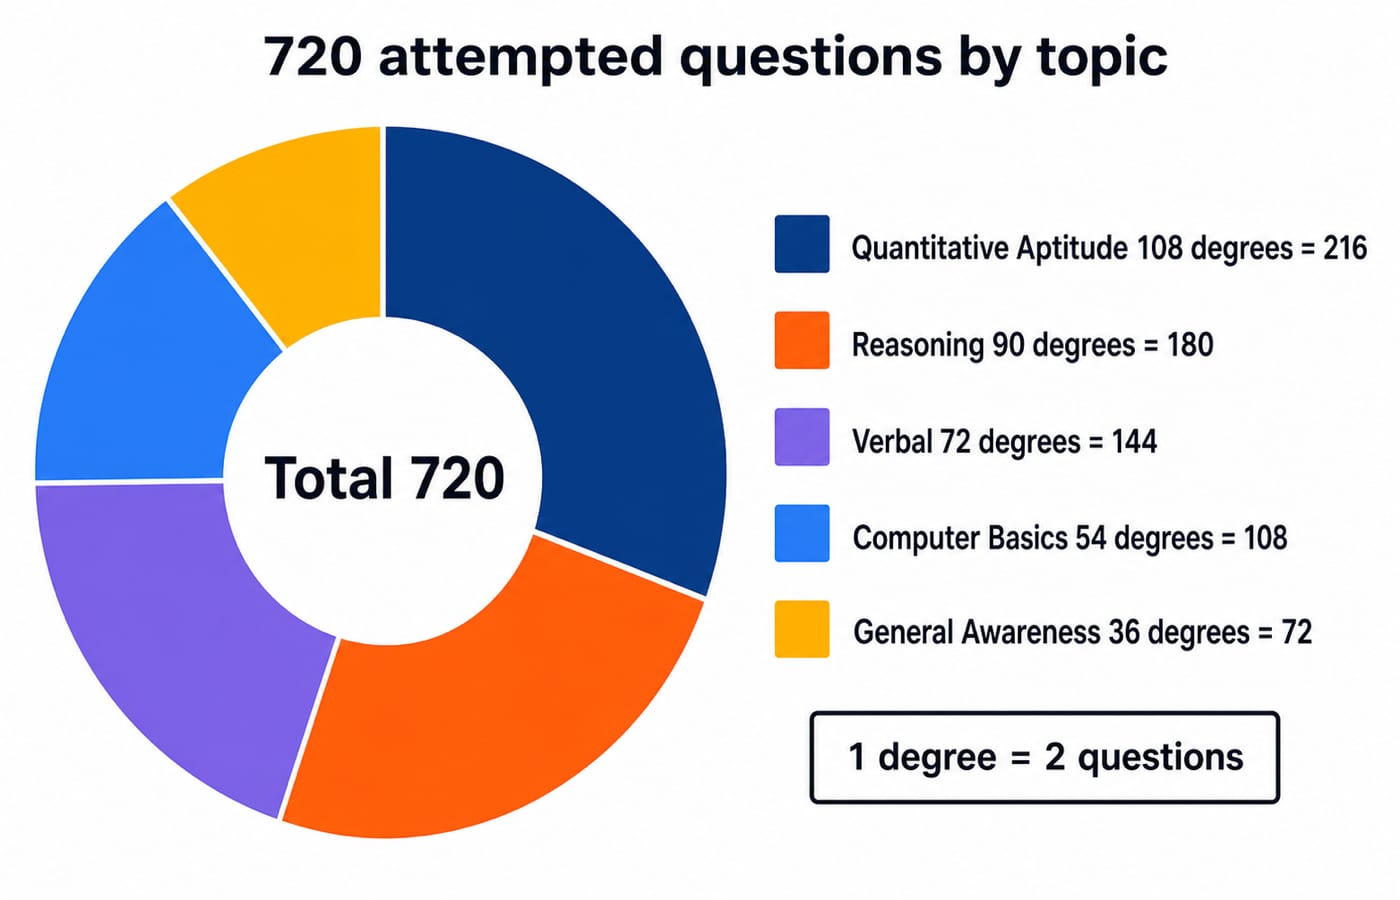
The 720 attempts are divided into angles of 108 degrees, 90 degrees, 72 degrees, 54 degrees and 36 degrees. Since 720/360 = 2, each degree represents two questions, giving counts of 216, 180, 144, 108 and 72.
What comparisons can you read from these counts?
Quantitative Aptitude and Reasoning together = 216 + 180 = 396, or 396/720 x 100 = 55%.
Quantitative Aptitude : Computer Basics = 216 : 108 = 2 : 1.
Verbal exceeds General Awareness by 144 - 72 = 72 questions.
Confirm your conversion: 108 + 90 + 72 + 54 + 36 = 360 degrees, and 216 + 180 + 144 + 108 + 72 = 720.
Solved Data Interpretation set 4: line-graph change and the successive-change trap
The line graph tracks weekly mock-test attempts across W1, W2, W3 and W4.
Week | Attempts |
|---|---|
W1 | 800 |
W2 | 1,000 |
W3 | 900 |
W4 | 1,170 |
1. What is the net percentage change from W2 to W4?
From W2 to W3, percentage change = (900 - 1,000)/1,000 x 100 = -10%. From W3 to W4, percentage change = (1,170 - 900)/900 x 100 = +30%.
Adding -10% and +30% suggests 20%, but that is wrong: the +30% acts on the smaller base of 900, not on 1,000.
Using the successive-change formula, net change = -10 + 30 + (-10 x 30)/100 = 20 - 3 = 17%. Check directly from W2 to W4: (1,170 - 1,000)/1,000 x 100 = 17%.
Both the successive-change formula and the direct W2-to-W4 calculation give 17% because they respect the changing base and the signs, while naive addition ignores the base shift.
2. What are the W1-to-W4 growth and the four-week average?
W1-to-W4 growth = (1,170 - 800)/800 x 100 = 370/800 x 100 = 46.25%. Four-week average = (800 + 1,000 + 900 + 1,170)/4 = 3,870/4 = 967.5.
Data Interpretation mistakes that shortcuts do not repair
Mistake | Why it fails | Correction |
|---|---|---|
Wrong percentage base | It changes the comparison | Identify what the change is relative to |
Treating grouped or stacked bars as one total | Series and combined height differ | Read the legend; add only when asked |
Confusing percentage points and percentage change | Subtraction is not relative change | Use points for rate differences and percent for relative change |
Averaging percentages with unequal bases | Large groups need more weight | Rebuild totals or use a weighted average |
Carrying units incorrectly | Thousands, lakhs, and percentages differ | Write units beside intermediate values |
Rounding early | Errors compound | Keep precision until the final step |
For unequal bases, 60% of 100 is 60 and 80% of 50 is 40. Combined, (60 + 40)/(100 + 50) = 100/150 = 66.67%, not 70%.
Check every set twice. First ask whether the result is plausible. Then verify totals, units, and denominator. For stronger underlying arithmetic, follow Aptitude for Placements: Section Topics and Weekly Plan.
Data Interpretation in competitive exams: how to practise for the actual test
Recurring DI skills include single-chart lookup, multi-step percentage or ratio, cross-chart comparison, and prose caselets that need a small table. Counts, marks, timing and negative-marking rules vary, so use the exam's current official notification.
In timed practice, scan the units and labels, answer the direct lookups, mark the questions that need derived totals, then return to the heavier comparisons. If you make a reading error, re-read the axis titles, legend and units before computing. If your setup is wrong, write the base under the fraction before dividing, so you decide “percentage of what” first. To catch an arithmetic slip, estimate the answer before calculating exactly, so an implausible result stands out. For a poor time choice, mark derived-total questions and return once the direct lookups are complete.
Use SSC CGL Quant Strategy: High-Yield Topics and Weekly Plan for broad arithmetic coverage and Bank PO Quant: High-Yield Topics First for chart and caselet practice. Verify your exam's pattern separately.
Data Interpretation: the short version and next step
Read the title and units. Fix the base. Reduce fractions early. Estimate before exact calculation. Verify the result against the chart.
Data Interpretation problems can involve tables, bar charts, pie charts and line graphs, with percentages, ratios, averages and successive change. For quantitative aptitude, reasoning, and verbal ability together, Aptitude Course for Placement is the structured next step.
Keep learning

Mensuration and Geometry for Competitive Exams: Formulas, Shortcuts and Solved Examples
Learn how to choose the right mensuration formula, avoid common geometry traps, and solve 2D path and 3D recasting problems step by step.
Updated 6 Oct 20266 min readAptitude & Reasoning

Age Comparison and Multiple-Condition Problems: 12 Solved MCQs
Practise 12 age-problem MCQs with equations, timelines, back-checks, relation chains, changing ratios, birth years, and family conditions.
1 Oct 20268 min readAptitude & Reasoning

True, False and Cannot Say Questions: 10 Solved Passage MCQs
Learn how to separate contradictions from missing evidence, then apply the method to 10 previous-year passage MCQs with concise, evidence-led solutions.
26 Sep 20268 min readAptitude & Reasoning

TCS Aptitude Questions: High-Yield Quant and Reasoning Topics, Solved Step by Step
Learn the first move for common quant and reasoning question families through solved examples on ratios, work, trains, data, remainders, and seating.
Updated 25 Sep 20266 min read104 viewsAptitude & Reasoning