The line graph shows the number of vacancies for executives in a certain…
2026
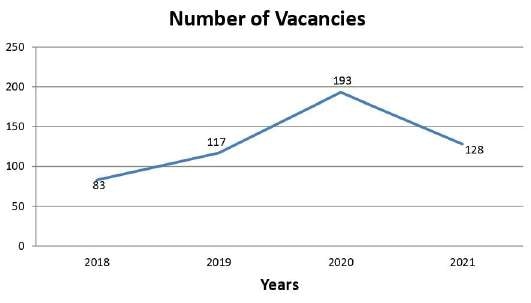
The line graph shows the number of vacancies for executives in a certain company. Study the diagram and answer the question that follows. In which year was the number of vacancies lesser than that of the previous year?
Answer: D. 2021 — Concept. On a line graph, every plotted point gives the value of the measured quantity for the year written beneath it on the horizontal axis. A quantity is…
- A.
2018
- B.
2020
- C.
2019
- D.
2021
Attempted by 98 students.
Show answer & explanation
Correct answer: D
Concept. On a line graph, every plotted point gives the value of the measured quantity for the year written beneath it on the horizontal axis. A quantity is lower than in the previous year exactly when its plotted value is smaller than the value plotted for the year immediately preceding it, which the line shows as a segment sloping downward from left to right. The earliest year on the axis has no preceding point, so no year-on-year comparison is defined for it.
Applying it here. Read the four plotted values off the vertical axis:
Year | Number of vacancies |
|---|---|
2018 | 83 |
2019 | 117 |
2020 | 193 |
2021 | 128 |
Now compare each year with the year immediately before it on the axis:
2019 against 2018: 117 − 83 = 34, so the count rises by 34.
2020 against 2019: 193 − 117 = 76, so the count rises by 76.
2021 against 2020: 128 − 193 = −65, so the count falls by 65.
2018 is the earliest year plotted, so there is no earlier value to compare it against.
Cross-check. The line climbs over its two earlier segments and descends over exactly one segment, the one running from the 2020 point down to the 2021 point. So exactly one of the years plotted carries a vacancy count smaller than the year before it.
Answer. 2021, where the vacancy count moves from 193 down to 128.