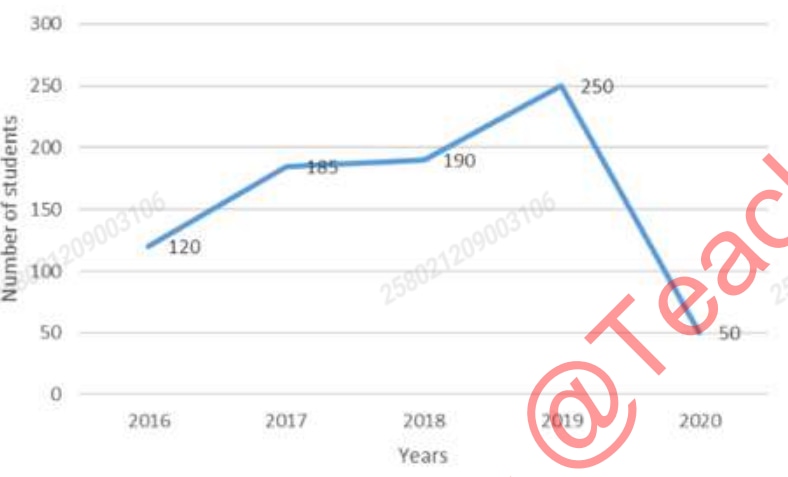
The following line graph shows the number of students who joined a school in…
2026
The following line graph shows the number of students who joined a school in the academic years 2016, 2017, 2018, 2019 and 2020. Find the approximate percentage increase in the number of students from 2018 to 2019.
Answer: A. 31.5% — ConceptPercentage increase compares the change with the original value. If an initial value A rises to a final value B, then percentage increase = ((B - A) /…
- A.
31.5%
- B.
66.6%
- C.
21%
- D.
75%
Attempted by 72 students.
Show answer & explanation
Correct answer: A
Concept
Percentage increase compares the change with the original value. If an initial value A rises to a final value B, then percentage increase = ((B - A) / A) × 100.
Application
Read the graph: the number of students is 190 in 2018 and 250 in 2019.
Increase = 250 - 190 = 60 students.
Percentage increase = (60 / 190) × 100 = 31.5789...%, which is approximately 31.6%.
Cross-check
Increasing 190 by 31.5% gives 190 × 1.315 = 249.85, which is approximately 250. Therefore, among the given values, the required approximate increase is 31.5%.