The line graph shows the ratio of a company’s exports to its imports from 2019…
2026
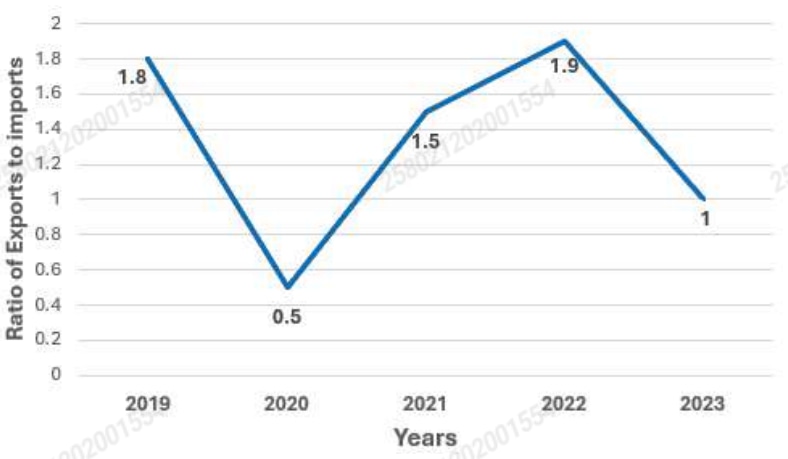
The line graph shows the ratio of a company’s exports to its imports from 2019 to 2023.
In how many of these years were the company’s exports greater than its imports?
Answer: D. 3 — ConceptFor a ratio E/I, exports exceed imports exactly when E/I > 1, assuming imports are positive. Therefore, compare each plotted ratio with the threshold…
- A.
1
- B.
2
- C.
4
- D.
3
Attempted by 89 students.
Show answer & explanation
Correct answer: D
Concept
For a ratio E/I, exports exceed imports exactly when E/I > 1, assuming imports are positive.
Therefore, compare each plotted ratio with the threshold 1; values above 1 count, while values equal to or below 1 do not.
Application
2019: The ratio is 1.8, and 1.8 > 1, so this year is counted.
2020: The ratio is 0.5, and 0.5 < 1, so this year is not counted.
2021: The ratio is 1.5, and 1.5 > 1, so this year is counted.
2022: The ratio is 1.9, and 1.9 > 1, so this year is counted.
2023: The ratio is 1, so exports and imports are equal; this year is not counted.
Cross-check
The ratios greater than 1 are 1.8, 1.5, and 1.9—three plotted values in total.
Result: Exports were greater than imports in 3 years.