Study the bar graph showing the quantity and value of engineering-goods…
2009
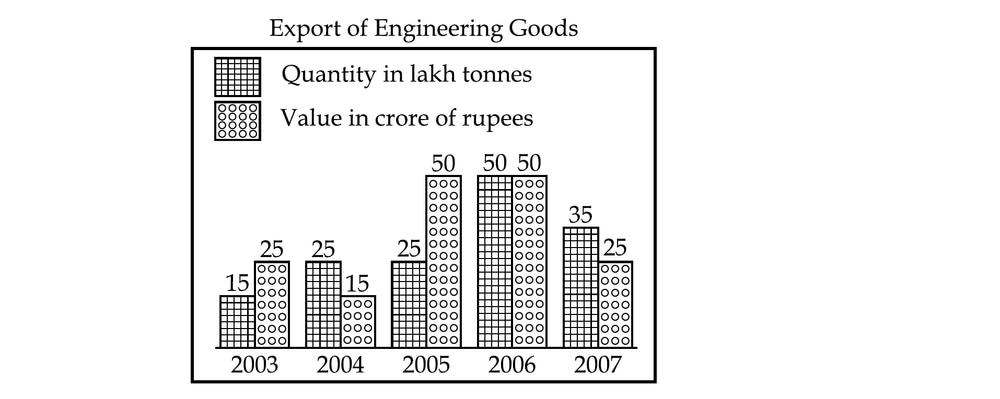
Study the bar graph showing the quantity and value of engineering-goods exports from 2003 to 2007, then answer the question.
In which year was the quantity of exports 100% higher than in the previous year?
Answer: C. 2006 — ConceptPercentage increase compares the change with the previous value: percentage increase = (new value − previous value) ÷ previous value × 100%. An…
- A.
2004
- B.
2005
- C.
2006
- D.
2007
Attempted by 5 students.
Show answer & explanation
Correct answer: C
Concept
Percentage increase compares the change with the previous value: percentage increase = (new value − previous value) ÷ previous value × 100%.
An increase of 100% means the new value is twice the previous value.
Application
Read the export quantities from the graph: 2003 = 15, 2004 = 25, 2005 = 25, 2006 = 50, and 2007 = 35 lakh tonnes.
For 2004: (25 − 15) ÷ 15 × 100% = 66.67%.
For 2005: (25 − 25) ÷ 25 × 100% = 0%.
For 2006: (50 − 25) ÷ 25 × 100% = 100%.
For 2007: (35 − 50) ÷ 50 × 100% = −30%, which is a decrease.
Cross-check
The 2006 quantity is 50 lakh tonnes, exactly twice the 2005 quantity of 25 lakh tonnes, so the increase is 100%.
Therefore, the required year is 2006.