Data in respect of Demand and Production of Computers of five companies, A - E…
2020
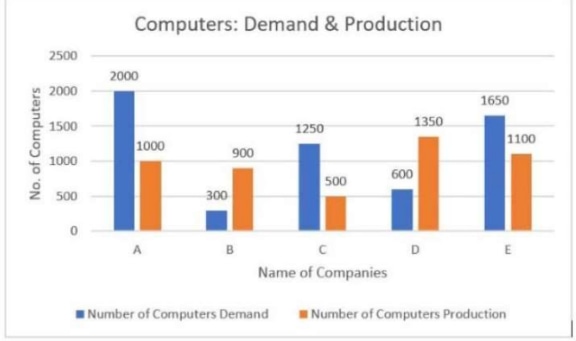
Data in respect of Demand and Production of Computers of five companies, A - E are shown in the figure. Based on the data, answer questions that follow.
The demand for computers is less than the production of computers in how many companies?
Answer: D. 2 — Concept. In a grouped (double) bar graph, every category on the horizontal axis carries one bar per data series, and the two bars are drawn against the same…
- A.
4
- B.
3
- C.
1
- D.
2
Attempted by 82 students.
Show answer & explanation
Correct answer: D
Concept. In a grouped (double) bar graph, every category on the horizontal axis carries one bar per data series, and the two bars are drawn against the same vertical scale. Comparing two series for one category is therefore a pure height comparison: the taller bar carries the larger value. A question of the form "in how many categories is series X less than series Y" is settled by checking the paired bars category by category and counting the matches — no totals, averages or percentages are involved.
Application. Each company on the horizontal axis carries a blue demand bar and an orange production bar, and every bar is labelled with its value. Reading the labels straight off the bar graph and comparing the pair for each company:
Company | Demand | Production | Comparison |
|---|---|---|---|
A | 2000 | 1000 | demand > production |
B | 300 | 900 | demand < production |
C | 1250 | 500 | demand > production |
D | 600 | 1350 | demand < production |
E | 1650 | 1100 | demand > production |
The companies whose demand falls below their production are B (300 against 900) and D (600 against 1350).
Cross-check. The other three companies — A, C and E — each have demand above production. Since 2 + 3 = 5, every one of the five companies plotted has been classified exactly once, so none was missed or counted twice. The two qualifying gaps are also wide (300 against 900, and 600 against 1350), so the reading does not hinge on judging a borderline bar height.
Result. Demand is less than production in 2 companies.