Data in respect of Demand and Production of Computers of five companies, A - E…
2020
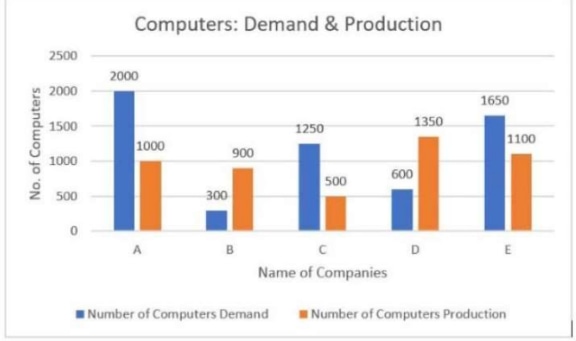
Data in respect of Demand and Production of Computers of five companies, A - E are shown in the figure. Based on the data, answer the question that follows.
Which company has the minimum demand to production ratio?
Answer: A. B — Concept: A demand-to-production ratio compares a company with itself: it is written demand : production, and its size does not depend on how tall the bars…
- A.
B
- B.
C
- C.
D
- D.
E
Attempted by 81 students.
Show answer & explanation
Correct answer: A
Concept: A demand-to-production ratio compares a company with itself: it is written demand : production, and its size does not depend on how tall the bars are, only on how the two bars of the same company compare. Turning each ratio into a single number by dividing demand by production makes the ratios directly comparable, and the smallest quotient marks the smallest ratio.
Application: Read both bars of every company off the graph and divide.
Read the demand bar and the production bar for each company from the vertical axis.
Divide demand by production to reduce that company’s ratio to a single number.
Compare the quotients and take the least one.
Company | Demand | Production | Demand ÷ Production |
|---|---|---|---|
A | 2000 | 1000 | 2000/1000 = 2 : 1 = 2.00 |
B | 300 | 900 | 300/900 = 1 : 3 ≈ 0.33 |
C | 1250 | 500 | 1250/500 = 5 : 2 = 2.50 |
D | 600 | 1350 | 600/1350 = 4 : 9 ≈ 0.44 |
E | 1650 | 1100 | 1650/1100 = 3 : 2 = 1.50 |
Cross-check: Only two quotients fall below 1, namely 1/3 and 4/9, so the contest is between them. Cross-multiplying avoids rounding: 1 × 9 = 9 while 3 × 4 = 12, and 9 < 12, so 1/3 < 4/9. The remaining companies sit at 2.00, 2.50 and 1.50, all above 1, so none of them can compete.
Therefore the minimum demand-to-production ratio is 1 : 3, and it belongs to Company B. Note that the tallest demand bar (Company A, 2000) does not give the largest or the smallest ratio — the absolute height of a bar is irrelevant; only the demand-to-production comparison within a company matters.