The following pie chart shows the expenditure incurred by a family in a month…
2021
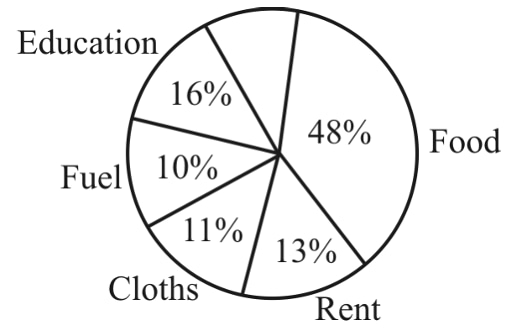
The following pie chart shows the expenditure incurred by a family in a month over different heads. If the total income of a family is ₹ 35000, how much has been spent on fuel & food?
Answer: B. ₹ 20300 — Step 1: From the pie chart, the percentage spent on Fuel is 10% and on Food is 48%. Step 2: Add the percentages for Fuel and Food: 10% + 48% = 58%. Step 3:…
- A.
₹ 10700
- B.
₹ 20300
- C.
₹ 30000
- D.
₹ 34000
Attempted by 47 students.
Show answer & explanation
Correct answer: B
Step 1: From the pie chart, the percentage spent on Fuel is 10% and on Food is 48%.
Step 2: Add the percentages for Fuel and Food: 10% + 48% = 58%.
Step 3: Calculate 58% of the total income (₹35000):
(58/100) × 35000 = ₹20300.
Thus, the total amount spent on fuel and food is ₹20300.
हिन्दी उत्तर:
चरण 1: पाई चित्र से, ईंधन पर खर्च किया गया प्रतिशत 10% और भोजन पर 48% है।
चरण 2: ईंधन और भोजन पर प्रतिशतों को जोड़ें: 10% + 48% = 58%।
चरण 3: कुल आय (₹35000) का 58% गणना करें:
(58/100) × 35000 = ₹20300।
इस प्रकार, ईंधन और भोजन पर कुल खर्च ₹20300 है।