The pie chart given below shows the population of seven states L, M, N, O, P,…
2021
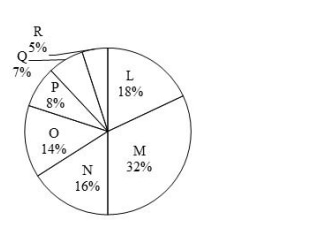
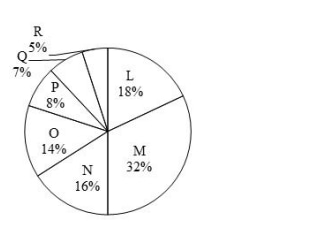
The pie chart given below shows the population of seven states L, M, N, O, P, Q and R. Total population of all these seven states is 225000. Population of a particular state is shown as a percent of total population of all these seven states. J1 = Sum of population of states N and O J2 = Difference between population of state M and N J3 = Average population of states M, N, O and P What is the value of (J1 + J2 + J3)?
Answer: B. 142875 — First, convert the percentage distribution of each relevant state into absolute population values (Total = 225,000): State M: 32% of 225,000 = 72,000 State N:…
- A.
137350
- B.
142875
- C.
147275
- D.
147350
Attempted by 75 students.
Show answer & explanation
Correct answer: B
First, convert the percentage distribution of each relevant state into absolute population values (Total = 225,000):
State M: 32% of 225,000 = 72,000
State N: 16% of 225,000 = 36,000
State O: 14% of 225,000 = 31,500
State P: 8% of 225,000 = 18,000
Next, calculate the variables:
J1 (Sum of N and O): 36,000 + 31,500 = 67,500
J2 (Difference between M and N): 72,000 - 36,000 = 36,000
J3 (Average of M, N, O, and P): (72,000 + 36,000 + 31,500 + 18,000) / 4 = 157,500 / 4 = 39,375
Finally, sum the variables:
J1 + J2 + J3 = 67,500 + 36,000 + 39,375 = 142,875