The pie-chart below shows the expenditure pattern of a person out of his total…
2013
The pie-chart below shows the expenditure pattern of a person out of his total income ₹ 28,000. If he saves ₹ 4,900, then the value of x is:
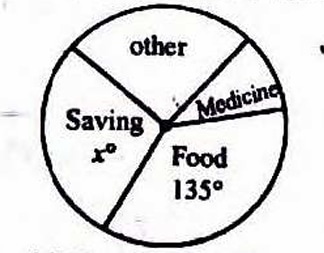
Answer: C. 63° — Step 1: The total income is ₹28,000 and the savings are ₹4,900. The fraction of income saved is calculated as: Fraction saved = 4900 / 28000 = 0.175 Step 2:…
- A.
136°
- B.
126°
- C.
63°
- D.
45°
Attempted by 28 students.
Show answer & explanation
Correct answer: C
Step 1: The total income is ₹28,000 and the savings are ₹4,900. The fraction of income saved is calculated as:
Fraction saved = 4900 / 28000 = 0.175
Step 2: In a pie chart, the total angle is 360°. The angle corresponding to savings is:
Angle for savings = 0.175 × 360° = 63°
Step 3: The angle for savings is given as x° in the pie chart. Therefore, x = 63.
हिन्दी उत्तर:
चरण 1: कुल आमदनी ₹28,000 है और बचत ₹4,900 है। बचत का भाग निकाला जाता है:
बचत का भाग = 4900 / 28000 = 0.175
चरण 2: पाई-चार्ट में कुल कोण 360° होता है। बचत के लिए कोण होता है:
बचत के लिए कोण = 0.175 × 360° = 63°
चरण 3: पाई-चार्ट में बचत के लिए कोण x° दिया गया है। इसलिए, x = 63।