The line chart given below shows the production of 6 companies in 2 years P…
2024
The line chart given below shows the production of 6 companies in 2 years P and Q.
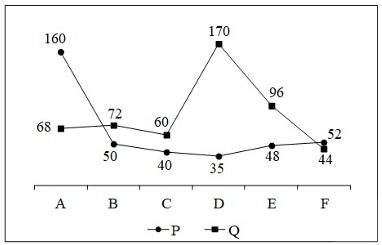
J1 = The total production of all companies in year P. J2 = The total production of all companies in year Q. What is the value of (J2 − J1)?
Answer: A. 125 — Solution Let J1 be the total production of all six companies in year P and J2 be the total production of all six companies in year Q. From the line chart:…
- A.
125
- B.
100
- C.
150
- D.
85
Attempted by 91 students.
Show answer & explanation
Correct answer: A
Solution
Let J1 be the total production of all six companies in year P and J2 be the total production of all six companies in year Q.
From the line chart:
Production in year P:
Company A = 160
Company B = 50
Company C = 40
Company D = 35
Company E = 48
Company F = 52
Therefore,
J1 = 160 + 50 + 40 + 35 + 48 + 52
= 210 + 40 + 35 + 48 + 52
= 250 + 35 + 48 + 52
= 285 + 48 + 52
= 333 + 52
= 385
Production in year Q:
Company A = 68
Company B = 72
Company C = 60
Company D = 170
Company E = 96
Company F = 44
Therefore,
J2 = 68 + 72 + 60 + 170 + 96 + 44
= 140 + 60 + 170 + 96 + 44
= 200 + 170 + 96 + 44
= 370 + 96 + 44
= 466 + 44
= 510
Now,
J2 − J1 = 510 − 385
= 125
Therefore, the value of (J2 − J1) is 125.
Answer: A) 125