The line chart given below shows the birth rate (per thousand persons) and…
2021
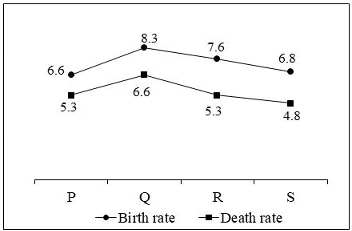
The line chart given below shows the birth rate (per thousand persons) and death rate (per thousand persons) of countries P, Q, R and S in the year 2018.
Statements:
I. Birth rate of country Q is 9.2 percent more than country R.
II. Birth rate of country R is 11.76 percent more than the birthrate of country S.
III. Birth rate of country Q is 32 percent more than the birth rate of country S.
Answer: C. Both I and II — Extract data (Birth Rates): Q = 8.3, R = 7.6, S = 6.8. Analyze Statement I: Is Q (8.3) 9.2% more than R (7.6)? Difference = 8.3 - 7.6 = 0.7. % Increase = (0.7…
- A.
Only I
- B.
Only II
- C.
Both I and II
- D.
Both I and III
Attempted by 73 students.
Show answer & explanation
Correct answer: C
Extract data (Birth Rates): Q = 8.3, R = 7.6, S = 6.8.
Analyze Statement I: Is Q (8.3) 9.2% more than R (7.6)?
Difference = 8.3 - 7.6 = 0.7. % Increase = (0.7 / 7.6) × 100 ≈ 9.21%. Statement I is correct.
Analyze Statement II: Is R (7.6) 11.76% more than S (6.8)?
Difference = 7.6 - 6.8 = 0.8. % Increase = (0.8 / 6.8) × 100 ≈ 11.76%. Statement II is correct.
Analyze Statement III: Is Q (8.3) 32% more than S (6.8)?
Difference = 8.3 - 6.8 = 1.5. % Increase = (1.5 / 6.8) × 100 ≈ 22.05%. Statement III is incorrect.
Since I and II are correct, the answer is "Both I and II".
Final Answer: Option C