Read the following table carefully and answer the question that follows. The…
2020
Read the following table carefully and answer the question that follows.
The following table embodies the details about the students of the different departments A, B and C in a University for participating in the blood donation camp.
Participation in Blood Donation Camp - Data
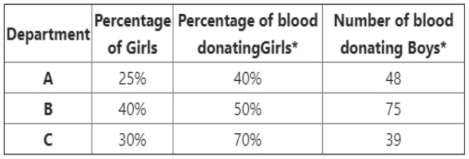
* Out of total blood donors.
Ques: The number of students who donated blood in the department 'C' is
Answer: C. 130 — When a data-interpretation table gives the percentage share of one sub-group within a total (for example, girls as a percentage of all blood donors) together…
- A.
39
- B.
91
- C.
130
- D.
169
Attempted by 2 students.
Show answer & explanation
Correct answer: C
When a data-interpretation table gives the percentage share of one sub-group within a total (for example, girls as a percentage of all blood donors) together with the exact count of the complementary sub-group (boys), the whole can be recovered using the percentage-reversal identity: if a part P is x% of a whole W, then W = P ÷ (x/100).
For department C, the table gives the percentage of blood-donating girls (out of total blood donors) as 70%, so girls make up 70% of department C's total blood donors.
Since every donor in the department is either a girl or a boy, boys must make up the remaining 100% - 70% = 30% of department C's total blood donors.
The table gives the number of blood-donating boys in department C as 39, and this count is exactly that 30% share of the total.
Applying the percentage-reversal identity: total blood donors in department C = 39 ÷ 30% = 39 ÷ 0.30 = 130.
Cross-check: the same identity applied to the other two rows of the table also returns clean whole numbers - department A's total is 48 ÷ 60% = 80, and department B's total is 75 ÷ 50% = 150 - confirming the method is being applied consistently across the table rather than fitting only one row by chance.
So the number of students who donated blood in department C is 130.