The following table represents the percentage expenditure of the annual income…
2024
The following table represents the percentage expenditure of the annual income of six persons A–F on six different items, namely, Food, Rent, Transport, Clothes, Entertainment and Miscellaneous. Based on the data in the table, answer the questions that follow.
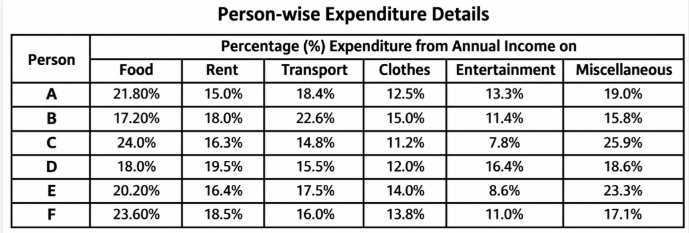
If the monthly income of A and D are ₹80000 and ₹72000, respectively, then the amount of money spent by A on Rent is ______ % more than the amount spent by D on clothes.
Answer: B. 38.89 — From the table: A → Rent = 15% D → Clothes = 12% A’s rent = 15% of 80000 = 12000 D’s clothes = 12% of 72000 = 8640 Percentage more = (12000 − 8640) ÷ 8640 ×…
- A.
32.62
- B.
38.89
- C.
36.54
- D.
34.24
Attempted by 3 students.
Show answer & explanation
Correct answer: B
From the table:
A → Rent = 15%
D → Clothes = 12%
A’s rent = 15% of 80000 = 12000
D’s clothes = 12% of 72000 = 8640
Percentage more =
(12000 − 8640) ÷ 8640 × 100 = 3360 ÷ 8640 × 100 ≈ 38.89%
Final Answer: 38.89