The following table represents the percentage expenditure of the annual income…
2024
The following table represents the percentage expenditure of the annual income of six persons A–F on six different items, namely, Food, Rent, Transport, Clothes, Entertainment and Miscellaneous. Based on the data in the table, answer the questions that follow.
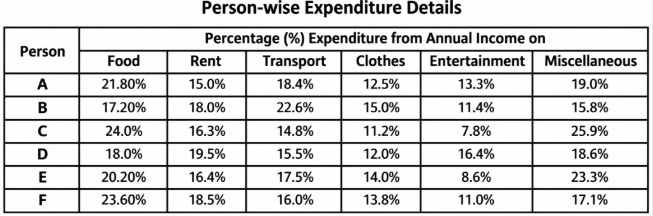
If the annual income of each of the six persons is ₹3 lakh, then the amount of money spent on clothes is more than ₹41800 by exactly ______ persons.
Answer: A. 2 — First, calculate the minimum percentage of income required to spend more than ₹41,800 on clothes. The annual income is ₹3,00,000. Threshold Percentage =…
- A.
2
- B.
3
- C.
4
- D.
5
Attempted by 3 students.
Show answer & explanation
Correct answer: A
First, calculate the minimum percentage of income required to spend more than ₹41,800 on clothes. The annual income is ₹3,00,000.
Threshold Percentage = (41,800 / 3,00,000) × 100 ≈ 13.93%
Now, check the 'Clothes' column in the table for each person to see who spends more than 13.93%:
- Person A: 12.5% (No)
- Person B: 15.0% (Yes, > 13.93%)
- Person C: 11.2% (No)
- Person D: 12.0% (No)
- Person E: 14.0% (Yes, > 13.93%)
- Person F: 13.8% (No)
Only Person B and Person E exceed the threshold. Therefore, exactly 2 persons spent more than ₹41,800 on clothes.