ER Diagram in DBMS: Complete Guide with Worked Examples for GATE and Interviews
Learn to read a crowded ER diagram, reduce it to the minimum relational tables, and avoid the weak-entity, multivalued-attribute, and relationship traps that change the answer.
KnowledgeGate Team
Exam prep & CS education
Updated 21 Aug 20267 min read
Knowing "entity" and "relationship" is not enough when a crowded ER diagram combines double lines, double ovals, and weak entities. Then comes the harder question: how many relational tables are required? For the university model below, with three strong entities, one weak entity, one multivalued attribute and one M:N relationship, the answer is six tables, and every rule that produces one of those six is separately examinable.
ER diagram in the design sequence: requirements to SQL
An ER diagram is the conceptual design built from requirements, before tables or SQL. The sequence is: requirements to ER diagram to relational tables to normalization to SQL. After reduction, continue with Normalization in DBMS: 1NF to BCNF, then query the schema with SQL Queries and Joins in DBMS.
The decisions taken at this stage are expensive to reverse. Whether a phone number is one column or a table of its own, whether a section can exist without its course, and whether grade belongs to the student, the course, or the pair of them are all settled on the diagram, and normalization inherits whatever the diagram got wrong.
Entities and the five attribute types
An entity is one distinguishable object, such as the student with roll number 42. An entity set collects similar objects; here it is STUDENT.
STUDENT has roll_no, name, address, phone, dob, and age. roll_no is the underlined key. name and stored dob are simple. Composite address splits into city and pin. Multivalued phone uses a double oval because a student can have two numbers. Derived age uses a dashed oval because it is computed from dob, not stored.
Symbol | Meaning |
|---|---|
Rectangle | Entity set |
Double rectangle | Weak entity set |
Oval | Attribute |
Double oval | Multivalued attribute |
Dashed oval | Derived attribute |
Underlined attribute | Key attribute |
Diamond | Relationship |
Double diamond | Identifying relationship |
Double line | Total participation |
Relationships: degree, cardinality, and participation
Relationship degree counts the participating entity sets. Binary relationships involve two sets and are the usual exam case.
The four cardinality ratios describe how many entities may be connected:
1:1: one entity on each side relates to at most one on the other side.
1:N: one
PROFESSORteaches manyCOURSEentities, while each course has one professor.N:1: the same
TEACHESrelationship read fromCOURSEtowardPROFESSOR.M:N: one
STUDENTenrols in many courses, and oneCOURSEhas many students.
Participation asks whether every entity must participate. Total participation uses a double line. In TEACHES, every course needs a professor, so COURSE is total. A professor may teach nothing, so PROFESSOR is partial. In min-max language, total means a minimum of one on that side.
grade belongs to ENROLLS, not STUDENT or COURSE, because it exists only for a student-course pair. This decides its destination during reduction.
Weak entities: why SECTION cannot stand alone
SECTION has sec_no and room, but section 1 can exist under many courses. It is a weak entity, drawn with a double rectangle, and sec_no is its dash-underlined partial key.
COURSE owns SECTION through double-diamond identifying relationship HAS. SECTION participates totally because it cannot exist without a course. HAS is 1:N from COURSE to SECTION.
The full key combines the owner's key and partial key, so it is (course_id, sec_no). A surrogate key would hide the conceptual dependency on COURSE that the ER model records.
The complete university ER diagram
The complete model has three strong entity sets and one weak entity set:
STUDENT(roll_no, name, address(city, pin), phone, dob, age)COURSE(course_id, title, credits)PROFESSOR(emp_id, pname)weak
SECTION(sec_no, room)
ENROLLS connects STUDENT and COURSE as M:N and carries grade. TEACHES connects PROFESSOR and COURSE as 1:N, with total participation by COURSE. Identifying relationship HAS connects COURSE and SECTION as 1:N, with total participation by SECTION.
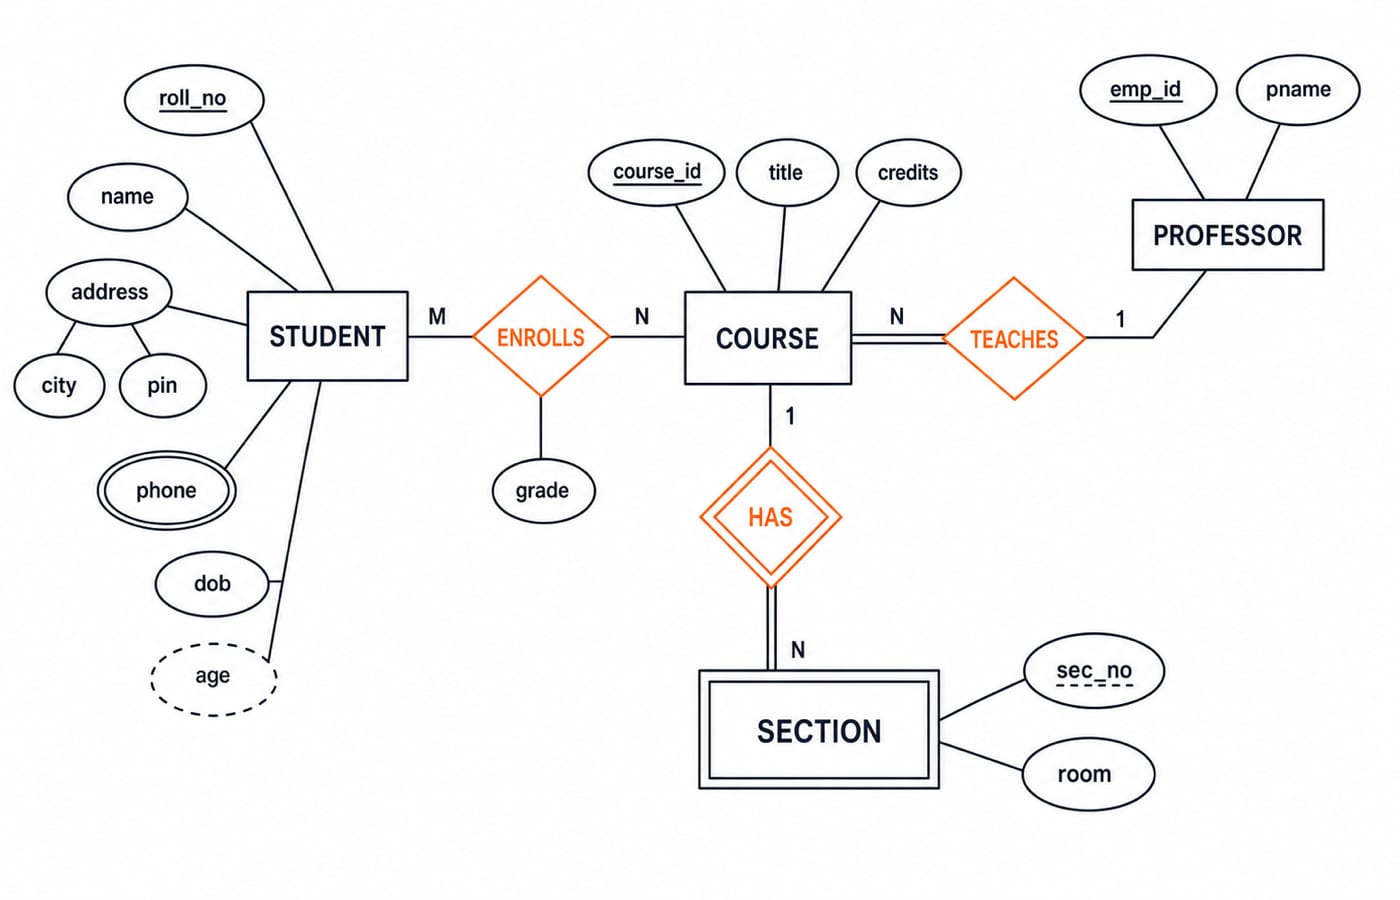
Read three facts from the figure. A course can have zero sections because COURSE is partial in HAS, although SECTION is total. A course cannot lack a professor because it is total in TEACHES. grade lives on ENROLLS, the student-course pair.
Reducing the ER diagram to relational tables
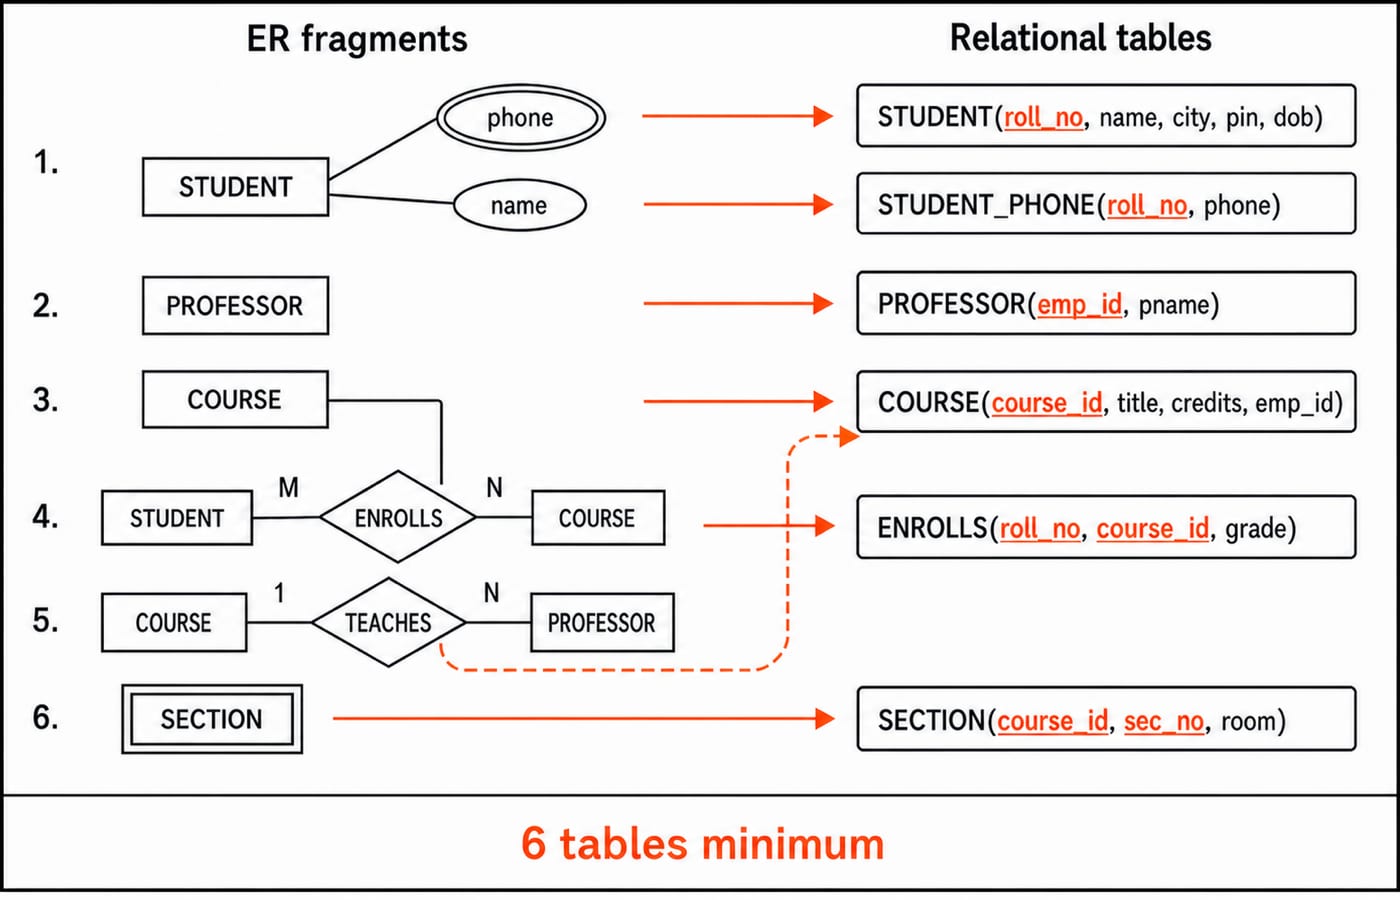
Apply the reduction rules in this order:
Create one table per strong entity. Flatten composite attributes and drop derived attributes.
Create one extra table for each multivalued attribute.
Create a weak-entity table whose key combines the owner key and partial key.
Create a table for every M:N relationship, including both entity keys and relationship attributes.
For 1:N, place the one-side key as a foreign key on the many side. Do not add a table.
For 1:1, merge the relationship into either side, preferably the side with total participation.
Applying those rules gives exactly these tables:
Table | Columns and key |
|---|---|
|
|
|
|
|
|
|
|
|
|
|
|
The count is 3 strong-entity tables + 1 multivalued-attribute table + 1 weak-entity table + 1 M:N relationship table = 6 tables. Neither 1:N relationship adds another table: TEACHES becomes COURSE.emp_id, while HAS is represented by SECTION.course_id.
Generalization, specialization, and aggregation
Specialization splits an entity set downward. From EMPLOYEE you carve TEACHING_STAFF and NON_TEACHING_STAFF, each keeping emp_id and adding attributes of its own. Generalization is the same link built upward, from the specific sets to the shared one. The ISA triangle carries two independent constraints: disjoint or overlapping, which asks whether one employee may sit in both subsets, and total or partial, which asks whether every employee must sit in at least one.
Reduction offers three shapes. Keep the parent table and give each child a table holding emp_id plus its extra attributes, which costs a join to read a full record. When the hierarchy is both disjoint and total, drop the parent instead and push every attribute down into the child tables. Or collapse the hierarchy into a single table with nullable columns and a type flag, which is the cheapest to query and the weakest at enforcing which columns must be filled.
Aggregation treats an entire relationship as though it were an entity, so that a second relationship can point at it. If a professor guides a (STUDENT, PROJECT) pair rather than a student or a project on its own, GUIDES attaches to the pair. Reducing that gives the inner relationship its own table keyed on (roll_no, project_id), and the outer relationship carries emp_id beside that composite key.
ER diagram traps that flip the answer
Merging M:N into one side: one foreign-key cell cannot hold many keys. Create
ENROLLSas a separate table.Forgetting a multivalued attribute: omitting
STUDENT_PHONEchanges the answer from the correct six tables to five.Misplacing a relationship attribute:
gradecannot describe a student or course alone. Keep it inENROLLS.Using the partial key alone:
sec_norepeats across courses. Use(course_id, sec_no)forSECTION.
Stripped-down counting questions, where the diagram is two nameless entity sets and one relationship, obey the same rules with fewer distractions. An M:N relationship between two strong entities always needs three tables, the same relationship read as 1:N needs two, and a 1:1 relationship with total participation on both sides collapses to one. Those configurations are worked through one at a time in ER Model to Relational Mapping for GATE.
How GATE and interviews test ER diagrams
GATE commonly tests minimum table counts, cardinality, participation, and weak-entity keys. The usual form is a diagram and four counts, where the gap between the right answer and the nearest wrong one is a single multivalued attribute that was forgotten, or a single 1:N relationship that was given a table it did not need. The exact CS syllabus wording for the current cycle sits on the organizing institute's official GATE syllabus page.
Interview prompts are practical: design a library, hospital, or cab-booking schema. Identify entities and keys, fix cardinalities and participation, place relationship attributes, then reduce the model to tables.
The short version and your next step
Read the symbols first. Separate cardinality from participation. Give every multivalued attribute and M:N relationship its own table, carry the owner's key into a weak entity, and fold 1:N into the many side. For this university model, those rules produce six tables, not five or seven.
For structured DBMS coverage across the syllabus, work through GATE Guidance by Sanchit Sir. To place DBMS against the rest of the paper before you plan revision, start from the GATE CS exam preparation hub.
Keep learning

Data Mining and Data Warehouse Explained: Concepts, OLAP and Worked Examples
Follow six orders from operational sources into a warehouse, calculate OLAP totals, and test an association rule on five shopping baskets.
Updated 4 Oct 20266 min readDBMS

Set Operations and Cartesian Product in Relational Algebra: Worked Examples and Exam Traps
Learn when relational set operations are legal, calculate exact union and difference results, enumerate a Cartesian product, and trace how a join filters it.
Updated 29 Sep 20266 min readDBMS
DBMS Interview Questions: Keys, Normalisation and Transactions Through One Worked Schema
Build defensible DBMS interview answers by tracing keys, normal forms, ACID and isolation through one university-enrolment database.
Updated 25 Sep 20265 min readDBMS
Super Key, Candidate Key and Primary Key: A Worked DBMS Example
Use one ENROLMENT relation to derive two candidate keys, enumerate every super key, select a primary key and translate the result into SQL.
Updated 24 Sep 20266 min readDBMS