How many students scored more than 40 marks?
2023
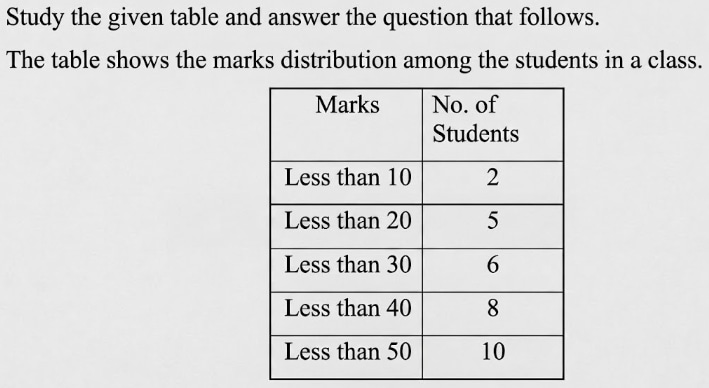
How many students scored more than 40 marks?
Answer: A. 2 — Concept: A "less than" table is a cumulative frequency distribution: the entry against "less than x" counts every observation that lies below the boundary x,…
- A.
2
- B.
4
- C.
5
- D.
3
Attempted by 1 students.
Show answer & explanation
Correct answer: A
Concept: A "less than" table is a cumulative frequency distribution: the entry against "less than x" counts every observation that lies below the boundary x, and each successive row adds one more class interval. Two consequences follow. The largest "less than" entry equals the total frequency N, and for any boundary L the observations not yet counted at L - that is, N minus the "less than L" entry - are exactly the ones lying in the classes above L.
Applying this to the given table:
Marks | No. of students (cumulative) |
|---|---|
Less than 10 | 2 |
Less than 20 | 5 |
Less than 30 | 6 |
Less than 40 | 8 |
Less than 50 | 10 |
The largest cumulative entry is the one against "Less than 50", so the total number of students in the class is N = 10.
The entry against "Less than 40" is 8, so 8 students lie in the classes below the boundary 40, namely 0-10, 10-20, 20-30 and 30-40.
The students left over are the ones in the classes above the 40 boundary: N minus 8 = 10 - 8 = 2. The last row shows that every student scored below 50, so these 2 students all lie in the final class 40-50. Hence 2 students scored more than 40 marks.
Boundary convention: Marks here are treated as a continuous variable grouped into the classes 0-10, 10-20, 20-30, 30-40 and 40-50, so a boundary value is counted with the class it opens. A "less than 40" entry therefore stops exactly at the boundary, and everyone beyond it sits in the 40-50 class. The table records only class totals, so a score of exactly 40 cannot be separated out from that class; on the standard convention used with such tables the count asked for is the class total, 2.
Cross-check: Convert the cumulative entries into individual interval frequencies by taking successive differences:
0-10: 2
10-20: 5 - 2 = 3
20-30: 6 - 5 = 1
30-40: 8 - 6 = 2
40-50: 10 - 8 = 2
These class frequencies add up to 2 + 3 + 1 + 2 + 2 = 10, which matches the total N = 10, so the table has been read correctly. Only the class 40-50 lies above the 40 boundary, and it contains 2 students - the same count reached above.
Common slip: Treating a cumulative entry such as 8 as though it were a single class total, or subtracting the two lowest rows instead of working from the total N, answers a different question about this table.