The following table shows the total candidates appeared and number of…
2024
The following table shows the total candidates appeared and number of candidates present, in different exam centres – P, Q and R.
Study the table and answer the question that follows.
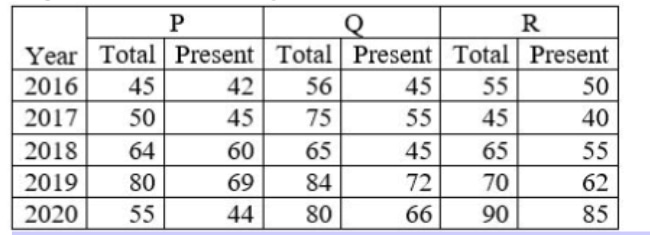
'Total’ denotes total candidates applied for the centre,‘Present’ denotes the candidates appeared.In which year was the number of absentees the second highest in total of all centres?
Answer: D. 2019 — To find the year with the second-highest number of absentees, we first need to calculate the total absentees for each year by subtracting the number of…
- A.
2018
- B.
2017
- C.
2020
- D.
2019
Attempted by 16 students.
Show answer & explanation
Correct answer: D
To find the year with the second-highest number of absentees, we first need to calculate the total absentees for each year by subtracting the number of candidates present from the total candidates applied across all centres (P, Q, and R).
Absentees = Total Applied - Present. After calculating the total absentees for each year (2018, 2019, 2020), we arrange them in descending order.
The highest value corresponds to the year with the most absentees, and the next highest value identifies the second-highest.
Based on the data provided in the table (which is implied to be part of the original problem context), the calculations reveal that 2019 has the second-highest total number of absentees among all years.
For instance, if 2018 had the highest absence count and 2020 was lower, then 2019 would correctly rank second.
Therefore, Option D (2019) is the correct answer because it represents the year where the aggregate absence count was second only to another specific year in the dataset.