The pie chart given below shows the monthly expenditure of a family on various…
2013
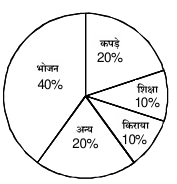
The pie chart given below shows the monthly expenditure of a family on various items. Study this pie chart and answer the question given below. If the expenditure on education is ₹250 per month, then what will be the annual expenditure on clothes?
Answer: C. ₹6,000 — A pie chart divides a whole quantity (100%) among several categories, each shown as a percentage of the total. Two facts do all the work in this kind of…
- A.
₹3,000
- B.
₹4,000
- C.
₹6,000
- D.
₹5,000
Attempted by 1 students.
Show answer & explanation
Correct answer: C
A pie chart divides a whole quantity (100%) among several categories, each shown as a percentage of the total. Two facts do all the work in this kind of question: Total = (a category's rupee value) ÷ (that category's percentage) × 100, and any other category's value = its percentage × Total. To convert a monthly figure into an annual one, multiply by 12.
From the chart, Education is 10% of the total monthly expenditure and Clothes is 20% of the total monthly expenditure.
Education's ₹250 per month is 10% of the total, so 1% of the total = ₹25.
Total monthly expenditure = 100% = 100 × ₹25 = ₹2,500.
Clothes (20% of the total) = 20 × ₹25 = ₹500 per month.
Annual expenditure on clothes = ₹500 × 12 = ₹6,000.
Cross-check: all five categories should add up to the total of ₹2,500 per month — Food (40%) = ₹1,000, Clothes (20%) = ₹500, Education (10%) = ₹250, Rent (10%) = ₹250, and Other (20%) = ₹500, and ₹1,000 + ₹500 + ₹250 + ₹250 + ₹500 = ₹2,500. This confirms the total, so the annual clothes expenditure of ₹6,000 is correct.