The given chart shows the production of different types of cars in the year…
2024
The given chart shows the production of different types of cars in the year 2021.
Study the given chart and answer the question that follows.
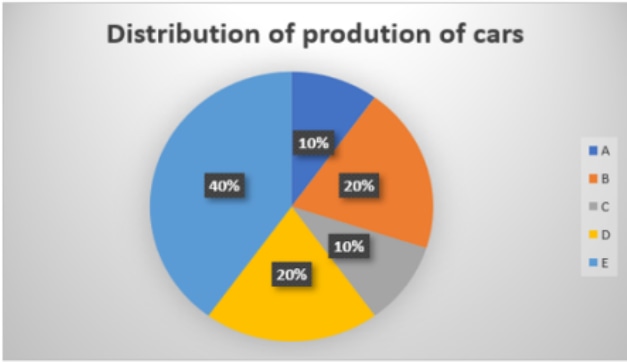
If the total production in the year 2021 was 2,00,00,000, then what will be the central angle of the sector representing the production of type D cars in 2021?
Answer: D. 72° — To find the central angle of a sector in a pie chart, you do not need the total production value (2,00,00,000) because the central angle depends entirely on…
- A.
50°
- B.
36°
- C.
42°
- D.
72°
Attempted by 3 students.
Show answer & explanation
Correct answer: D
To find the central angle of a sector in a pie chart, you do not need the total production value (2,00,00,000) because the central angle depends entirely on the percentage the sector represents out of the whole (360 degrees).
Calculation Steps
Identify the percentage for Type D: From the chart, the yellow sector representing Type D cars is 20%.
Apply the central angle formula:
The formula for the central angle is: (Percentage / 100) * 360°
Central Angle = (20 / 100) * 360°
Central Angle = 0.20 * 360° = 72°