Study the given graph and answer the question that follows. The graph shows…
2024
Study the given graph and answer the question that follows.
The graph shows the production of refrigerators by three companies in 2018.
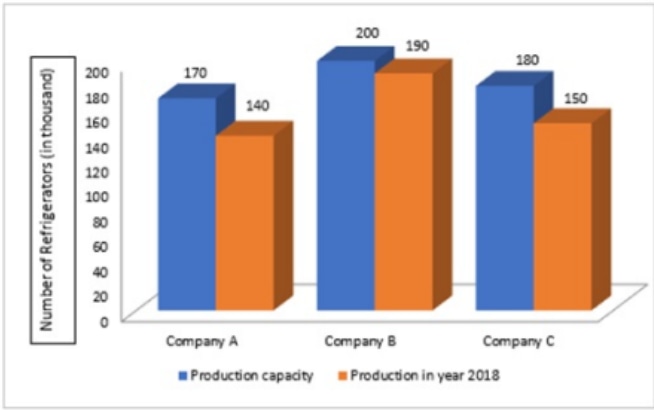
The refrigerators produced by company C form what percentage of the total production?
Answer: D. 31.25% — Correct Option Option D: 31.25% Step-by-Step Solution Extract Production Data for 2018 (Orange Bars): Company A = 140 Company B = 190 Company C = 150…
- A.
34.35%
- B.
32.56%
- C.
30.25%
- D.
31.25%
Attempted by 54 students.
Show answer & explanation
Correct answer: D
Correct Option
Option D: 31.25%
Step-by-Step Solution
Extract Production Data for 2018 (Orange Bars):
Company A = 140
Company B = 190
Company C = 150
Calculate Total Production:
Total Production = Company A + Company B + Company C
Total Production = 140 + 190 + 150 = 480
Calculate Company C's Percentage:
Percentage = (Company C Production / Total Production) * 100
Percentage = (150 / 480) * 100
Percentage = 0.3125 * 100 = 31.25%
Summary Note
It is important to note that the solution text provided in the image contains a calculation error, as it sums the total values of both production capacity and actual production (860) rather than focusing only on the production in the year 2018 as requested by the question. The correct total production for 2018 is 480, leading to the correct percentage of 31.25%.