The given bar graph shows the number of students enrolled in Institutes A and…
2024
The given bar graph shows the number of students enrolled in Institutes A and B during 5 years (2018 to 2022).
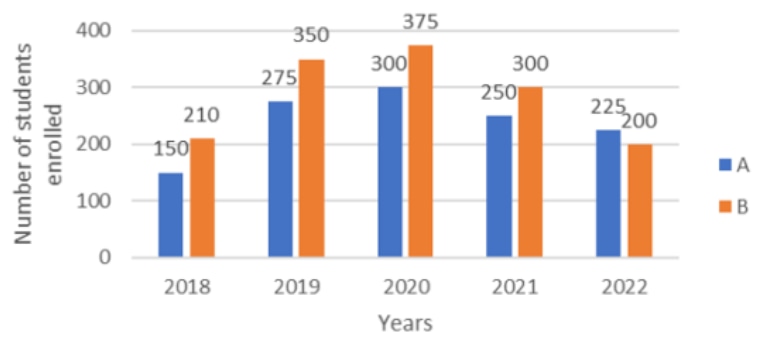
What is the ratio of the total students enrolled in Institute B in 2019, 2020 and 2022 to that of the total students enrolled in Institute A in 2018, 2020 and 2021?
Answer: A. 37 : 28 — To find the required ratio, we need to extract the data from the bar graph for the specified years and institutes and then perform the calculations. Step 1:…
- A.
37 : 28
- B.
11 : 28
- C.
28 : 11
- D.
28 : 37
Attempted by 5 students.
Show answer & explanation
Correct answer: A
To find the required ratio, we need to extract the data from the bar graph for the specified years and institutes and then perform the calculations.
Step 1: Calculate the Total Students in Institute B for 2019, 2020, and 2022
From the bar graph (orange bars):
2019: 350
2020: 375
2022: 200
Total for Institute B = 350 + 375 + 200 = 925
Step 2: Calculate the Total Students in Institute A for 2018, 2020, and 2021
From the bar graph (blue bars):
2018: 150
2020: 300
2021: 250
Total for Institute A = 150 + 300 + 250 = 700
Step 3: Find the Ratio
The ratio required is (Total B) : (Total A) = 925 : 700.
To simplify this ratio, divide both numbers by their greatest common divisor (GCD).
Both numbers are divisible by 25:
925 ÷ 25 = 37
700 ÷ 25 = 28
The simplified ratio is 37 : 28.