Study the given graph and answer the question that follows. The average number…
2022
Study the given graph and answer the question that follows.
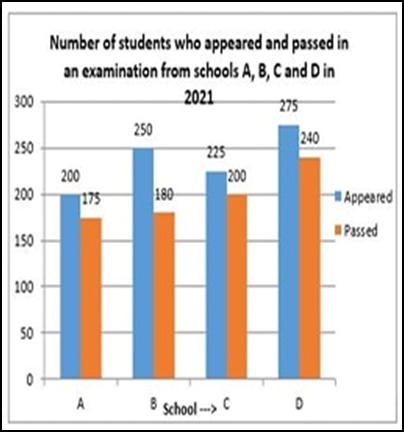
The average number of students (per school) who passed from schools A, C and D is what percentage less than the total number of students who appeared from school B?
Answer: B. 18% — Identify the number of students who passed from schools A, C, and D: 175, 200, and 240. Calculate their average: (175 + 200 + 240) / 3 = 615 / 3 = 205.…
- A.
16%
- B.
18%
- C.
21%
- D.
22%
Attempted by 103 students.
Show answer & explanation
Correct answer: B
Identify the number of students who passed from schools A, C, and D: 175, 200, and 240.
Calculate their average: (175 + 200 + 240) / 3 = 615 / 3 = 205.
Identify the total number of students who appeared from school B: 250.
Calculate the percentage less: [(Appeared B - Average Passed A,C,D) / Appeared B] * 100 = [(250 - 205) / 250] * 100 = (45 / 250) * 100 = 18%.
Final Answer: Option 2