The following bar graph shows a comparison between the sales (in thousands) of…
2025
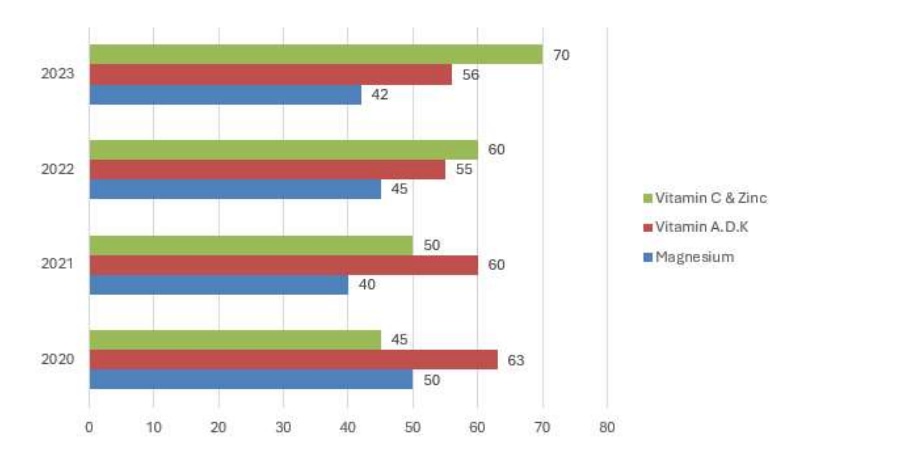
The following bar graph shows a comparison between the sales (in thousands) of three health supplements sold by a pharma company over a period of four years. Study the bar graph and answer the question that follows.
What is the ratio of the sales of the Vitamin C & Zinc supplement in the year 2020 to that in the year 2022 for this company?
- A.
5 : 6
- B.
3 : 4
- C.
1 : 2
- D.
9 : 10
Attempted by 2 students.
Show answer & explanation
Correct answer: B
Concept: For a bar graph, the ratio of a quantity across two years is found by reading each bar's value directly from the chart and writing them as a fraction in the order requested, then simplifying to lowest terms.
Application:
Read the height of the Vitamin C & Zinc bar (green) for the year 2020 from the chart: 45 (thousand).
Read the height of the Vitamin C & Zinc bar for the year 2022 from the chart: 60 (thousand).
Write the ratio in the order asked, 2020 sales : 2022 sales = 45 : 60.
Divide both terms by their greatest common factor, 15: 45 ÷ 15 : 60 ÷ 15 = 3 : 4.
Cross-check: Converting 45 : 60 to a decimal gives 45/60 = 0.75 = 3/4, confirming the simplified ratio independently.
So the ratio of the Vitamin C & Zinc supplement’s sales in 2020 to its sales in 2022 is 3 : 4.