Comprehension Passage- The following table shows the cumulative percentage of…
2025
Comprehension Passage- The following table shows the cumulative percentage of the total number of students appearing in the Hindi and Punjabi examination and the cumulative number of students appearing in the Hindi examination and scoring marks in five different categories, namely, 80 and above; 70 and above; 60 and above; 50 and above; and 40 and above. Based on the data in the table, answer the questions that follow.Marks-wise distribution of students
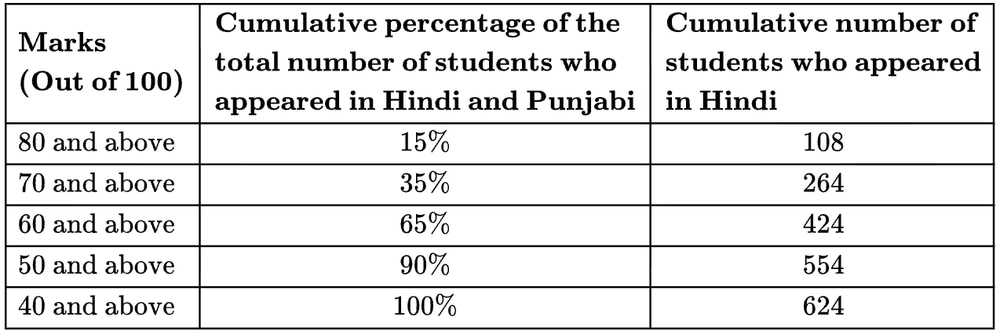
Note-
1. Total number of students who attended the exam is 1200.
2. No student failed in the examination.
3. Each student appeared in only one exam, that is, either in Hindi or in Punjabi exam.
What is the ratio of the number of students who scored 50 or more than 50 marks but less than 60 marks in Hindi to the number of students who scored 40 or more than 40 marks but less than 50 marks in Punjabi?
Answer: D. 13:5 — First, calculate the number of Hindi students who scored between 50 and 60 marks. This is found by subtracting the cumulative count for '60 and above' (424)…
- A.
12:11
- B.
8:7
- C.
3:1
- D.
13:5
Attempted by 12 students.
Show answer & explanation
Correct answer: D
First, calculate the number of Hindi students who scored between 50 and 60 marks.
This is found by subtracting the cumulative count for '60 and above' (424) from '50 and above' (554), which gives 130 students.
Next, determine the number of Punjabi students who scored between 40 and 50 marks.
The total percentage of students scoring 40-50 is 10% (100% - 90%), which equals 120 students (10% of 1200).
The number of Hindi students in this range is 70 (624 - 554). Therefore, Punjabi students in this range are 120 - 70 = 50.
Finally, the ratio of Hindi students (130) to Punjabi students (50) is 130:50, which simplifies to 13:5.