Comprehension Passage- The following table shows the cumulative percentage of…
2025
Comprehension Passage- The following table shows the cumulative percentage of the total number of students appearing in the Hindi and Punjabi examination and the cumulative number of students appearing in the Hindi examination and scoring marks in five different categories, namely, 80 and above; 70 and above; 60 and above; 50 and above; and 40 and above. Based on the data in the table, answer the questions that follow.Marks-wise distribution of students
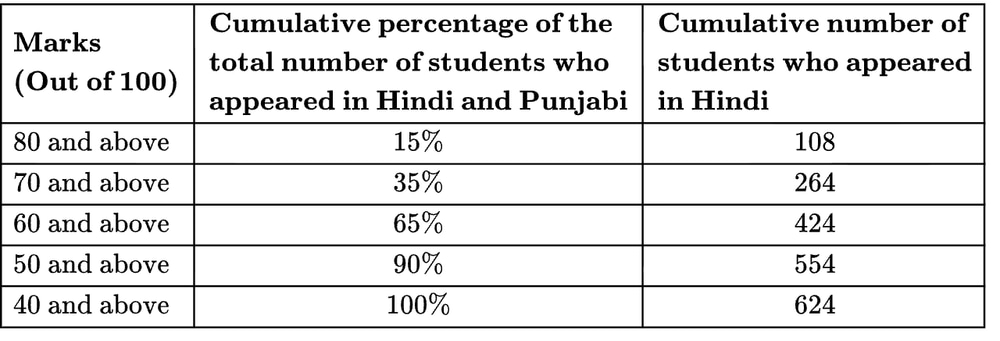
Note-
1. Total number of students who attended the exam is 1200.
2. No student failed in the examination.
3. Each student appeared in only one exam, that is, either in Hindi or in Punjabi exam.
The number of students who scored 80 and above marks in Hindi is ____ less than the number of students who scored 60 or more than 60 marks but less than 70 marks in Punjabi.
Answer: A. 46 — Total students = 1200 Students scoring 60 and above in both Hindi and Punjabi: 65% x 1200 = 780 Students scoring 70 and above in both Hindi and Punjabi: 35% x…
- A.
46
- B.
54
- C.
44
- D.
52
Attempted by 14 students.
Show answer & explanation
Correct answer: A
Total students = 1200
Students scoring 60 and above in both Hindi and Punjabi: 65% x 1200 = 780
Students scoring 70 and above in both Hindi and Punjabi: 35% x 1200 = 420
Therefore, students scoring 60 to less than 70 in both subjects: 780−420=360
Now for Hindi:
Students scoring 60 and above in Hindi = 424
Students scoring 70 and above in Hindi = 264
So, Hindi students scoring 60 to less than 70: 424−264=160
Hence Punjabi students scoring 60 to less than 70: 360−160=200
Students scoring 80 and above in Hindi = 108
Difference: 200−108=92
Required percentage less than:
92/200 × 100=46%
Hence, the correct answer is: 46