Study the following graph carefully and answer questions. In which year the…
2009
Study the following graph carefully and answer questions.
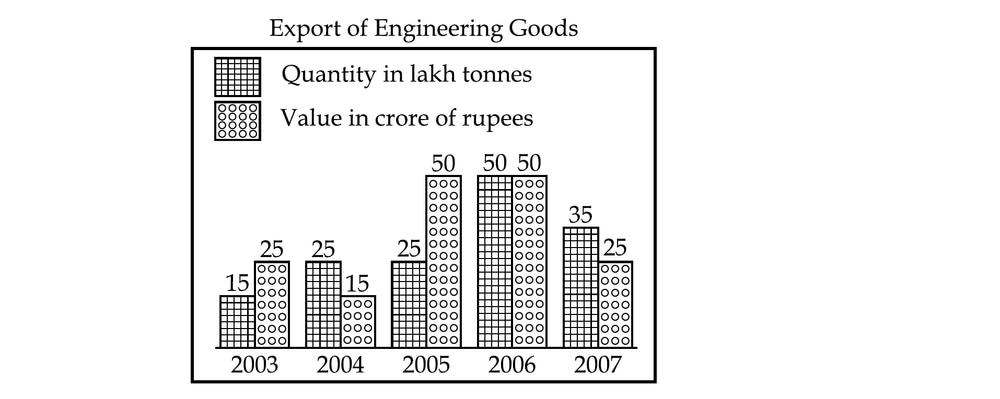
In which year the value of engineering goods decreased by 50 percent compared to the previous year ?
Answer: B. 2007 — Concept — Percentage change always compares a quantity with its OWN earlier value, never with a different series. For two consecutive years, percentage…
- A.
2004
- B.
2007
- C.
2005
- D.
2006
Attempted by 1 students.
Show answer & explanation
Correct answer: B
Concept — Percentage change always compares a quantity with its OWN earlier value, never with a different series. For two consecutive years, percentage decrease = (previous year’s figure − current year’s figure) ÷ previous year’s figure × 100. A decrease of exactly 50 percent therefore means the current year’s figure is half of the previous year’s figure. In a double bar graph each year carries two independent bars, so only the series named in the question — value in crore of rupees — may be read; the quantity bars belong to a different series with a different unit.
Application — read the value bars (crore of rupees) off the graph and test each year against its own previous year.
The value series read year by year is: 2003 → 25, 2004 → 15, 2005 → 50, 2006 → 50, 2007 → 25 (crore of rupees).
2003 to 2004: the figure falls from 25 to 15, a drop of 10 on a base of 25, so the change is 10 ÷ 25 × 100 = 40 percent decrease.
2004 to 2005: the figure moves from 15 to 50, which is a rise, so no decrease is possible here.
2005 to 2006: the figure stays at 50, a change of 0, so the decrease is 0 percent.
2006 to 2007: the figure falls from 50 to 25, a drop of 25 on a base of 50, so the change is 25 ÷ 50 × 100 = 50 percent decrease. Equivalently, 25 is half of 50, which is the halving test stated in the concept. The year asked for is therefore 2007.
Cross-check — every consecutive pair set out against the base year it must be measured on:
Year | Value (₹ crore) | Previous year value | Change on that base |
|---|---|---|---|
2004 | 15 | 25 (in 2003) | 40 percent decrease |
2005 | 50 | 15 (in 2004) | increase, not a decrease |
2006 | 50 | 50 (in 2005) | 0 percent, unchanged |
2007 | 25 | 50 (in 2006) | 50 percent decrease |
A common trap is to read the quantity bars instead. Quantity (lakh tonnes) runs 15, 25, 25, 50, 35, and its largest fall is 50 to 35 in 2007, which is 15 ÷ 50 × 100 = 30 percent — so the other series never produces a 50 percent drop either, and the answer must come from the value bars alone.