Study the following graph carefully and answer questions. In which year the…
2009
Study the following graph carefully and answer questions.
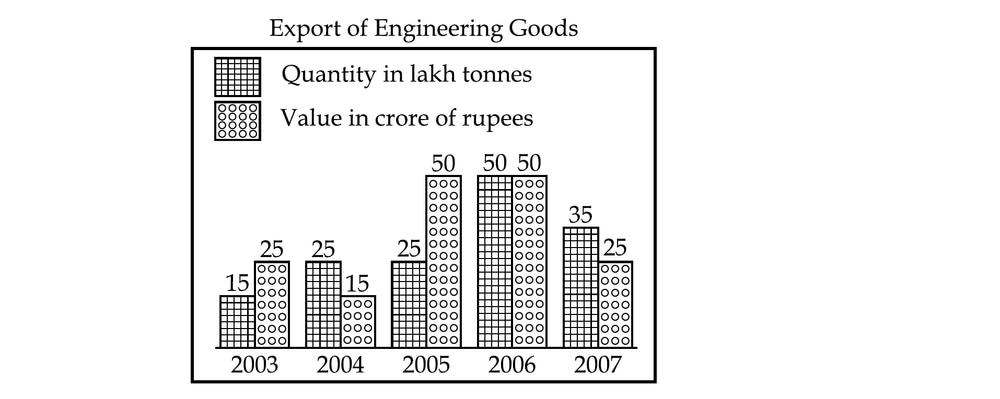
In which year the quantity of engineering goods’ exports was maximum ?
Answer: B. 2006 — Concept: A grouped (dual-series) bar graph draws two separate measurements side by side for every category, identified by the legend. The two series carry…
- A.
2005
- B.
2006
- C.
2004
- D.
2007
Show answer & explanation
Correct answer: B
Concept: A grouped (dual-series) bar graph draws two separate measurements side by side for every category, identified by the legend. The two series carry different units, so a bar from one series is never compared with a bar from the other. A "which category is the maximum" question is settled by reading only the series the question names and comparing that single series across all categories.
Application: The question asks about quantity, so only the "Quantity in lakh tonnes" bars are read and the "Value in crore of rupees" bars are set aside. Reading the quantity series year by year off the graph:
Year | Quantity (lakh tonnes) | Value (crore of rupees) |
|---|---|---|
2003 | 15 | 25 |
2004 | 25 | 15 |
2005 | 25 | 50 |
2006 | 50 | 50 |
2007 | 35 | 25 |
Comparing the quantity series alone: 50 > 35 > 25 = 25 > 15. The largest quantity reading is 50 lakh tonnes, recorded in 2006, so the quantity of engineering goods exported was maximum in 2006.
Cross-check and contrast:
The value series also reaches 50 above 2005, but that 50 is in crore of rupees, not lakh tonnes; the quantity reading for 2005 is only 25 lakh tonnes. Comparing the tallest bar on the page instead of the tallest quantity bar is the standard trap in a dual-series graph.
2007 is the latest year plotted and its quantity rises to 35 lakh tonnes, but a later year is not automatically a larger one; the quantity series falls from 50 to 35 between 2006 and 2007.
2004 and 2005 both read 25 lakh tonnes on the quantity series, so they are tied with each other and neither can be the single highest reading.
Independent check: the quantity readings 15, 25, 25, 50, 35 have a single largest term, 50, and it sits above the 2006 label, so the maximum is unique and unambiguous.