Direction : Study the given graph given below and answer the following…
2018
Direction : Study the given graph given below and answer the following questions
The graph given below shows the percentage of literates in three different villages in three years
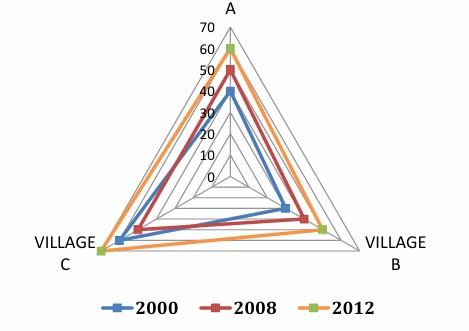
If population of A in 2000, 2008 and 2012 is in ratio 2 : 3 : 4 and average of literate in 2008, 2012 and 2000 be 1410 then find population of village A in 2000.
Answer: D. 1800 — ConceptWhen two quantities are linked by a percentage, the part equals the whole times the rate: number of literates = population x (literacy% / 100). When…
- A.
1700
- B.
2000
- C.
2100
- D.
1800
- E.
2200
Attempted by 2 students.
Show answer & explanation
Correct answer: D
Concept
When two quantities are linked by a percentage, the part equals the whole times the rate: number of literates = population x (literacy% / 100). When several years are involved and the populations are given as a ratio, write each population as that ratio multiplied by a common factor, express each year's literates with its own rate, and then apply the average condition to solve for the single unknown factor.
Reading the graph (Village A)
From the Village A axis of the chart, the literacy percentages for the three years are:
Year 2000: 40%
Year 2008: 50%
Year 2012: 60%
Application
Let the common factor be x, so the populations of village A are 2x (2000), 3x (2008) and 4x (2012), matching the ratio 2 : 3 : 4.
Literates in 2000 = 2x x 40% = 0.8x
Literates in 2008 = 3x x 50% = 1.5x
Literates in 2012 = 4x x 60% = 2.4x
Total literates over the three years = 0.8x + 1.5x + 2.4x = 4.7x
Average literates = total / 3 = 4.7x / 3, and this equals 1410, so 4.7x = 1410 x 3 = 4230
x = 4230 / 4.7 = 900
Population of village A in 2000 = 2x = 2 x 900 = 1800
Cross-check
With x = 900 the literates are 0.8(900) = 720, 1.5(900) = 1350 and 2.4(900) = 2160; their sum is 4230 and 4230 / 3 = 1410, exactly the given average. So the population in 2000 is 1800.