

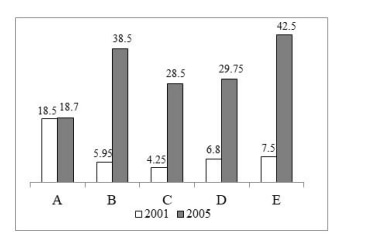
The bar graph given below shows the sales of five different products (in…
PYQ DSSSB 2021
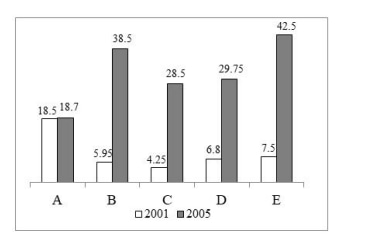
The bar graph given below shows the sales of five different products (in lakhs) A, B, C, D and E during 2001 and 2005 by a company. I. In 2001 sales of product B is 56.67 percent more than the sales of product C. II. In 2001 sales of product A is 146.67 percent more than the sales of product E. III. Ratio of sales of product C in 2001 to the sales of product D in 2005 is 1 : 7.
- A.
Only I
- B.
Only II
- C.
Only III
- D.
Both II and III
Attempted by 131 students.
Sign up free to check your answer
Sign up freeLoading lesson…