

The following bar graph shows a comparison between the sales (in thousands) of…
PYQ DSSSB 2025
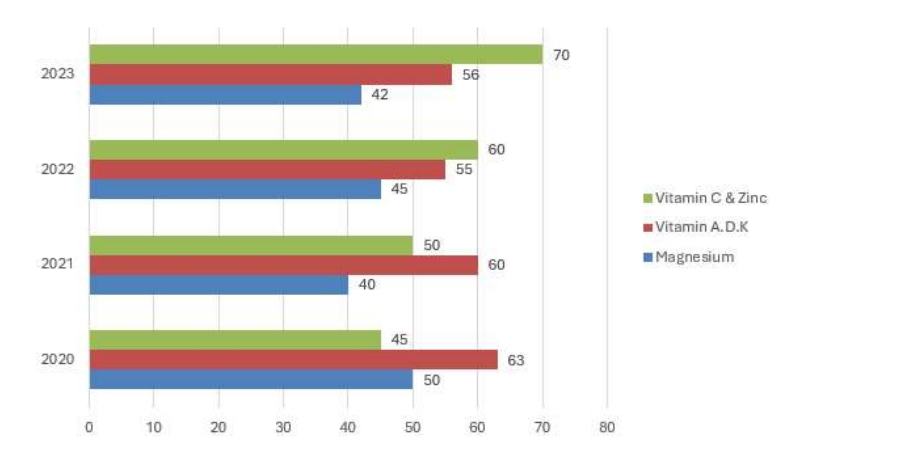
The following bar graph shows a comparison between the sales (in thousands) of three health supplements sold by a pharma company over a period of four years. Study the bar graph and answer the question that follows.
What is the ratio of the sales of the Vitamin C & Zinc supplement in the year 2020 to that in the year 2022 for this company?
- A.
5 : 6
- B.
3 : 4
- C.
1 : 2
- D.
9 : 10
Attempted by 342 students.
Sign up free to check your answer
Sign up freeLoading lesson…