

Study the given graph and answer the following question. Production of rice by…
PYQ DSSSB 2023Modified — slightly modified from the official paper; see the solution
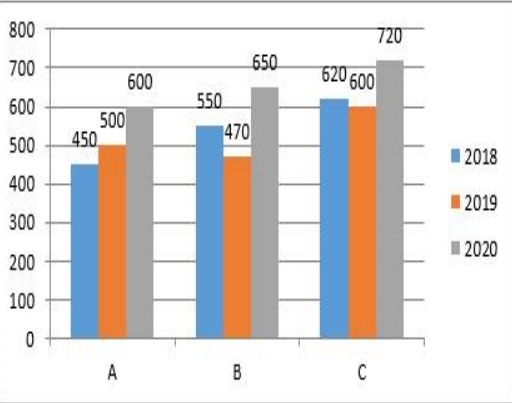
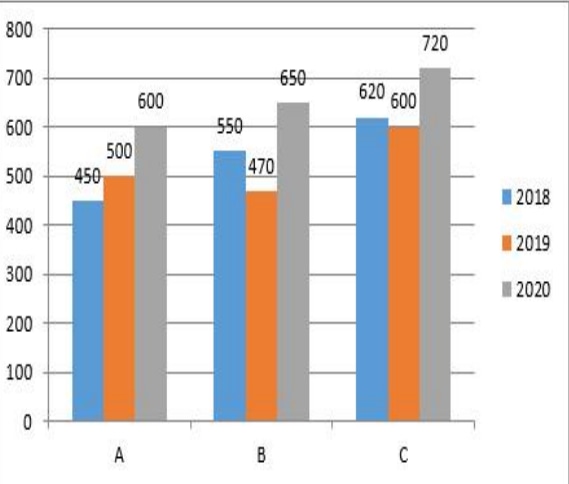
Study the given graph and answer the following question. Production of rice by states A, B and C during 2018 to 2020 (in lakh tonnes).
The average production of rice (per year) by states A, B and C in 2018 is what percentage less than the production of rice by state C in 2020?
- A.
18 %
- B.
20 %
- C.
25 %
Attempted by 261 students.
Sign up free to check your answer
Sign up freeLoading lesson…