

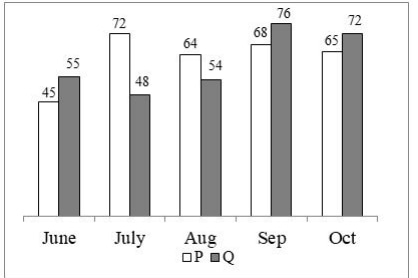
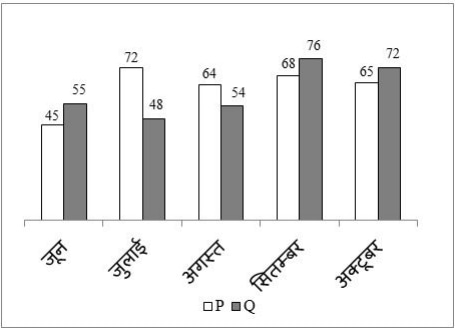
The bar graph given below shows the production of soaps (in thousands) by two…
PYQ DSSSB 2021
The bar graph given below shows the production of soaps (in thousands) by two companies P and Q from June to October. Which of the following statement(s) is/are correct? I. Total number of soaps produced by P in July is 28.5% more than Q in that month. II. Total number of soaps produced by P in August is 18.5% more than Q in that month. III. Total number of soaps produced by P and Q in September is 1,44,000.
- A.
Only I
- B.
Only II
- C.
Only III
- D.
II and III
Attempted by 175 students.
Sign up free to check your answer
Sign up freeLoading lesson…