

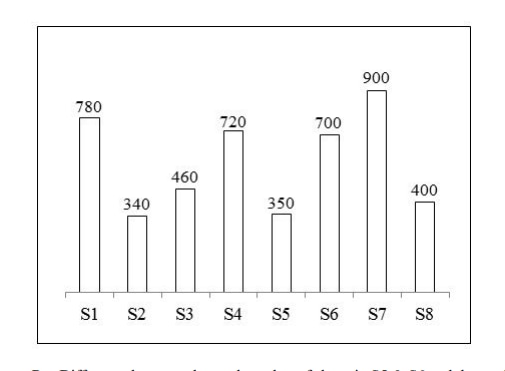
The bar graph given below shows the number of shoes in 8 shops R = Difference…
PYQ DSSSB 2021
The bar graph given below shows the number of shoes in 8 shops R = Difference between the total number of shoes in S5 & S6 and the total number of shoes in S1 & S8. T = Average number of shoes in S2, S4 and S5. What is the value of R + T?
- A.
720
- B.
480
- C.
540
- D.
600
Attempted by 132 students.
Sign up free to check your answer
Sign up freeLoading lesson…