Directions: The pie-graph given below shows the breakup of the cost of…
2024
Directions: The pie-graph given below shows the breakup of the cost of construction of a house. Assuming that the total cost of construction is Rs 600000, answer the question given below:
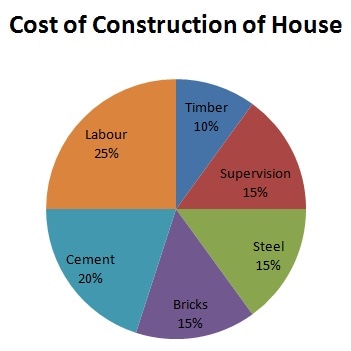
The sum spent on cement is:
Answer: C. Rs 120000 — Concept: In a pie chart, each sector's percentage directly represents that item's share of the whole; so the rupee amount spent on any category equals (that…
- A.
Rs 120045
- B.
Rs 120078
- C.
Rs 120000
- D.
Rs 120023
Attempted by 6 students.
Show answer & explanation
Correct answer: C
Concept: In a pie chart, each sector's percentage directly represents that item's share of the whole; so the rupee amount spent on any category equals (that category's percentage divided by 100) multiplied by the total amount, since all the sector percentages together add up to 100% of the total.
Application:
From the chart, the Cement sector is labelled 20% of the total construction cost.
Total cost of construction = Rs 6,00,000.
Amount spent on cement = 20/100 x 6,00,000 = Rs 1,20,000.
Cross-check:
All sector percentages sum to 100%: Timber 10% + Supervision 15% + Steel 15% + Bricks 15% + Cement 20% + Labour 25% = 100%, confirming the chart is internally consistent.
Rs 1,20,000 divided by Rs 6,00,000 = 0.20 = 20%, matching the Cement label exactly.
Hence, the sum spent on cement is Rs 1,20,000.