Study the following bar graph carefully and answer the question given below.…
2023
Study the following bar graph carefully and answer the question given below.
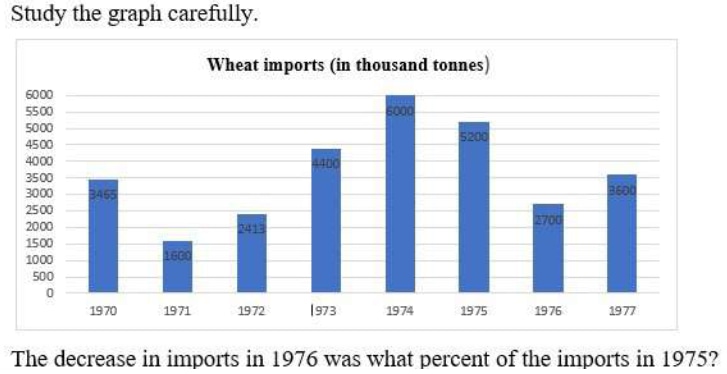
The decrease in imports in 1976 was what percent of the imports in 1975?
- A.
48.07%
- B.
49%
- C.
48%
- D.
50%
Show answer & explanation
Correct answer: A
Percentage decrease of a quantity relative to a reference (base) value is calculated as: percentage decrease = ((base value − new value) / base value) × 100. When a question asks "the decrease in X was what percent of Y", the base for the percentage is explicitly Y, not X.
From the bar graph, the 1975 wheat imports = 5200 thousand tonnes and the 1976 wheat imports = 2700 thousand tonnes.
Decrease in imports = 1975 value − 1976 value = 5200 − 2700 = 2500 thousand tonnes.
Percentage decrease relative to the 1975 base = (2500 / 5200) × 100 = 48.0769...%, i.e. approximately 48.08%; the offered option, 48.07%, is the nearest match (the source answer key drops the second decimal down rather than rounding up).
Cross-check: 48.07% of 5200 = 0.4807 × 5200 ≈ 2500, which matches the computed decrease. Equivalently, the 1976 figure is (2700/5200) × 100 ≈ 51.92% of the 1975 figure, so the fall is the complement, 100% − 51.92% ≈ 48.08% ≈ 48.07%, the same result by a second route.
So the decrease in imports in 1976 is approximately 48.08% (48.07% among the offered options) of the imports in 1975.