A survey is taken among few students of a class on what pets they like. The…
2017
A survey is taken among few students of a class on what pets they like. The choices provided to them are: Rabbits, Fishes and Cats. A below Venn diagrams is prepared for the survey. Study the below Venn diagram and answer the question.
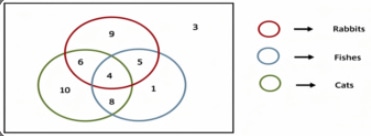
Which pet is liked by 24 students?
- A.
Cats
- B.
Rabbits
- C.
Fish
- D.
None of these
Attempted by 1 students.
Show answer & explanation
Correct answer: B
To determine which pet is liked by 24 students based on the Venn diagram in image_a890fa.png, we calculate the sum of the numbers within each circle:
Rabbits (Red Circle): The regions within this circle contain the values 9, 6, 5, and 4. The sum is 9 + 6 + 5 + 4 = 24.
Fishes (Blue Circle): The regions within this circle contain the values 6, 5, 4, and 8. The sum is 6 + 5 + 4 + 8 = 23.
Cats (Green Circle): The regions within this circle contain the values 10, 6, 4, and 8. The sum is 10 + 6 + 4 + 8 = 28.