Rabbits, Fishes and Cats. A below Venn diagrams is prepared for the survey.…
2017
Rabbits, Fishes and Cats. A below Venn diagrams is prepared for the survey. Study the below Venn diagram and answer the question.
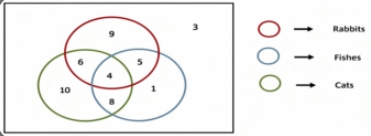
How may students like Cats and Rabbits?
- A.
10
- B.
6
- C.
4
- D.
2
Attempted by 1 students.
Show answer & explanation
Correct answer: A
To determine how many students like both Cats and Rabbits, we need to examine the intersection of the two circles representing these categories in the Venn diagram.
Step-by-Step Analysis
Identify the circles: Based on the provided legend, the "Rabbits" circle is red, and the "Cats" circle is green.
Locate the intersection: We need the area where the red circle and green circle overlap. This overlap consists of two distinct regions:
Region 1: The area where only the red and green circles intersect (excluding the blue "Fishes" circle). In this diagram, this region contains the number 6.
Region 2: The central area where all three circles (red, green, and blue) intersect. In this diagram, this region contains the number 4.
Calculate the total: To find all students who like both Cats and Rabbits, we add these two regions together: 6 + 4 = 10.