A survey is taken among few students of a class on what pets they like. The…
2017
A survey is taken among few students of a class on what pets they like. The choices provided to them are: Rabbits, Fishes and Cats. A below Venn diagrams is prepared for the survey. Study the below Venn diagram and answer the question.
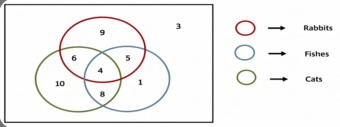
How many total students are present in the class?
- A.
40
- B.
46
- C.
45
- D.
47
Attempted by 1 students.
Show answer & explanation
Correct answer: B
To find the total number of students in the class, we must sum all the values provided in the Venn diagram. The total represents both the students who chose at least one pet (those inside the circles) and those who chose none (the value outside the circles).
Step-by-Step Calculation
The values provided in the diagram are:
Values inside the circles: 9, 6, 10, 4, 8, 5, 1
Value outside the circles: 3
To find the total, simply add all these figures together:
Total = 9 + 6 + 10 + 4 + 8 + 5 + 1 + 3
Sum of inner values: 9 + 6 + 10 + 4 + 8 + 5 + 1 = 43
Add the outer value: 43 + 3 = 46