The figure below represents a ____
2013
The figure below represents a ____
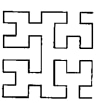
Answer: A. Hilbert curve of order 3 — CONCEPTA Hilbert curve approximation is formed recursively: each order replaces the previous path with four scaled, rotated copies joined into one continuous…
- A.
Hilbert curve of order 3
- B.
Hilbert curve of order 2
- C.
Hilbert curve of order 1
- D.
Hilbert curve of order 4
Attempted by 362 students.
Show answer & explanation
Correct answer: A
CONCEPT
A Hilbert curve approximation is formed recursively: each order replaces the previous path with four scaled, rotated copies joined into one continuous path. Every new order doubles the grid resolution along each side and adds one more level of right-angle detail. Write Hn for the order-n approximation.
At order n, the path visits 4n grid points on a 2n × 2n grid and therefore contains 4n − 1 connecting segments.
APPLICATION
Order 1 uses a 2 × 2 grid, visits 4 points, and forms the basic U-shaped path with 3 segments.
Order 2 uses a 4 × 4 grid, visits 16 points, and forms 15 segments with one nested level of right-angle turns.
The given curve has the 8 × 8 resolution and two nested levels produced by the next recursive step. Thus it visits 64 points and contains 63 connecting segments.
CONTRAST
Order 1 has only the basic U-shaped path on a 2 × 2 grid, so it lacks nested detail.
Order 2 has one nested level on a 4 × 4 grid, so its path is visibly coarser.
Order 4 has three nested levels on a 16 × 16 grid, so its path is visibly finer.
CROSS-CHECK
Substituting n = 3 gives 43 − 1 = 64 − 1 = 63 segments. An order-4 approximation would instead have 44 − 1 = 255 segments and visibly finer, three-level nesting.
Therefore, the figure represents a Hilbert curve of order 3.