The following line graph gives the percentage of the number of candidates who…
2024
The following line graph gives the percentage of the number of candidates who qualified an examination out of the total number of candidates who appeared for the examination over a period of seven years from 1994 to 2000.
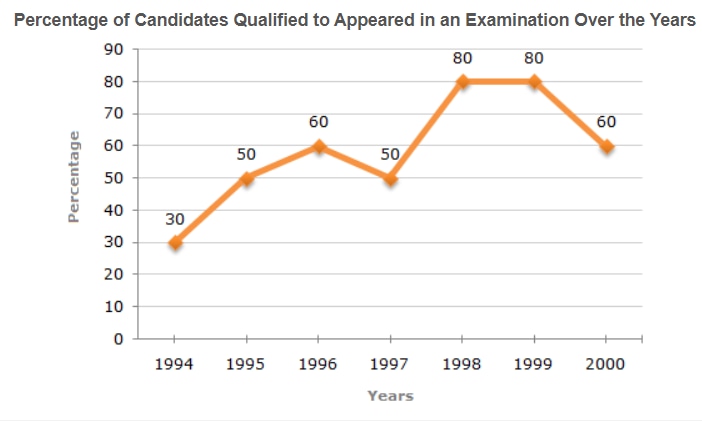
If the total number of candidates appeared in 1996 and 1997 together was 47400, then the total number of candidates qualified in these two years together was?
- A.
34700
- B.
32100
- C.
31500
- D.
Data inadequate
Attempted by 396 students.
Show answer & explanation
Correct answer: D
Answer: Data inadequate.
Let the number of candidates who appeared in 1996 be x and in 1997 be y. We are given x + y = 47400. From the graph, the percentage qualified in 1996 is 60% and in 1997 is 50%.
Total qualified = 0.6x + 0.5y
Substitute y = 47400 - x:
Total qualified = 0.6x + 0.5(47400 - x) = 23700 + 0.1x
Because x (the number who appeared in 1996) is not specified, the expression 23700 + 0.1x depends on x and can vary.
If x = 0 (all 47400 appeared in 1997), qualified = 23700.
If x = 47400 (all 47400 appeared in 1996), qualified = 28440.
Thus the total number qualified can be any value between 23700 and 28440 depending on how the 47400 is split between the two years. The exact total cannot be determined from the given information; therefore the data is inadequate. Also, the numeric choices 31500, 32100, and 34700 lie outside this feasible range, so none of them can be correct.