The following line graph gives the percentage of the number of candidates who…
2025
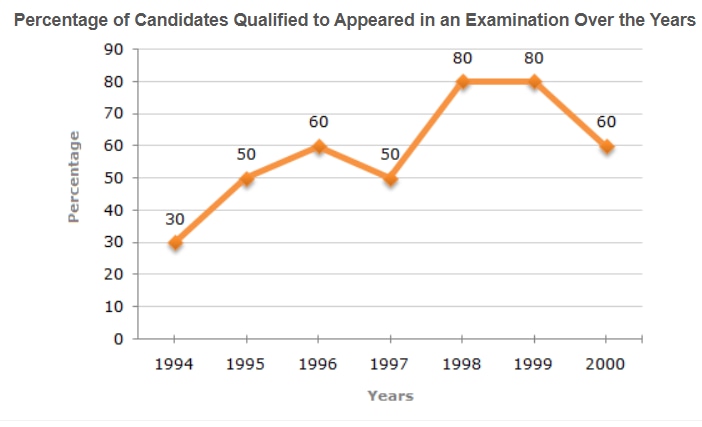
The following line graph gives the percentage of the number of candidates who qualified an examination out of the total number of candidates who appeared for the examination over a period of seven years from 1994 to 2000.
In which pair of years was the number of candidates qualified, the same?
- A.
1995 and 1997
- B.
1995 and 2000
- C.
1998 and 1999
- D.
Data inadequate
Attempted by 457 students.
Show answer & explanation
Correct answer: D
Answer: Data inadequate. The graph shows percentages, not absolute counts.
Percentages from the graph: 1994 = 30%, 1995 = 50%, 1996 = 60%, 1997 = 50%, 1998 = 80%, 1999 = 80%, 2000 = 60%.
1998 and 1999 (and also 1995 and 1997) have the same percentage qualified, but equal percentages only mean the same proportion qualified.
To know whether the absolute number of candidates qualified is the same between two years, you must know the total number of candidates who appeared in those years or the absolute counts of qualified candidates.
Because the graph provides only percentages and not the totals or absolute counts, the data is inadequate to determine in which pair of years the number of candidates qualified was the same.