These questions are based on following graphs Classification of appeared…
2025
These questions are based on following graphs Classification of appeared candidates in a competitive test from different states and qualified candidates from those states.
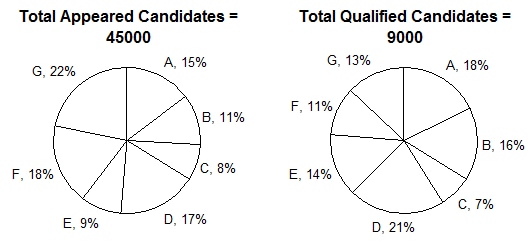
In which State the percentage of qualified candidates to that of appeared candidates is minimum ?
- A.
C
- B.
F
- C.
D
- D.
E
Attempted by 370 students.
Show answer & explanation
Correct answer: B
Solution: Compute the percentage of qualified candidates out of those who appeared for each state.
Totals from charts: total appeared = 45000, total qualified = 9000. For each state: Qualified number = (qualified% of 9000); Appeared number = (appeared% of 45000). Success rate = (Qualified number / Appeared number) × 100.
State A: qualified = 18% of 9000 = 1620; appeared = 15% of 45000 = 6750; success rate = 1620/6750 × 100 = 24.00%.
State B: qualified = 16% of 9000 = 1440; appeared = 11% of 45000 = 4950; success rate = 1440/4950 × 100 ≈ 29.09%.
State C: qualified = 7% of 9000 = 630; appeared = 8% of 45000 = 3600; success rate = 630/3600 × 100 = 17.50%.
State D: qualified = 21% of 9000 = 1890; appeared = 17% of 45000 = 7650; success rate = 1890/7650 × 100 ≈ 24.71%.
State E: qualified = 14% of 9000 = 1260; appeared = 9% of 45000 = 4050; success rate = 1260/4050 × 100 ≈ 31.11%.
State F: qualified = 11% of 9000 = 990; appeared = 18% of 45000 = 8100; success rate = 990/8100 × 100 ≈ 12.22%.
State G: qualified = 13% of 9000 = 1170; appeared = 22% of 45000 = 9900; success rate = 1170/9900 × 100 ≈ 11.82%.
Conclusion: The smallest success rate overall is for state G (≈11.82%). However, among the answer choices provided (states C, F, D, E), state F has the smallest success rate (≈12.22%). Therefore, state F is the correct choice from the given options.