Here, Column I shows the percentage of viewers of each village, P, Q, R, S,…
2022
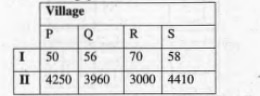
Here, Column I shows the percentage of viewers of each village, P, Q, R, S, who watch less than 3 movies on television per week. Column II shows the total number of viewers of each village who watch 3 or more movies on television per week. Study the table and answer the following questions : The village, where the number of people watching movies on television is the lowest –
Answer: C. P — Concept: when a table gives, for each group, the share (%) of a sub-population and the count of the complementary sub-population, the group's total = (given…
- A.
R
- B.
S
- C.
P
- D.
Q
Attempted by 199 students.
Show answer & explanation
Correct answer: C
Concept: when a table gives, for each group, the share (%) of a sub-population and the count of the complementary sub-population, the group's total = (given count) ÷ (that sub-population's share as a decimal). To find which group has the lowest overall total, convert every group's count + percentage into a total this way, then compare the totals directly.
Application — Village P: 50% watch less than 3 movies, so 50% watch 3 or more. Total = 4250 ÷ 0.50 = 8,500.
Village Q: 56% watch less than 3 movies, so 44% watch 3 or more. Total = 3,960 ÷ 0.44 = 9,000.
Village R: 70% watch less than 3 movies, so 30% watch 3 or more. Total = 3,000 ÷ 0.30 = 10,000.
Village S: 58% watch less than 3 movies, so 42% watch 3 or more. Total = 4,410 ÷ 0.42 = 10,500.
Cross-check: village P's own split is the simplest (50% / 50%), so its total is directly 2 × 4,250 = 8,500, independent of any other village's arithmetic — confirming the value without relying on comparison alone.
Result: comparing all four totals — 8,500 (P), 9,000 (Q), 10,000 (R), 10,500 (S) — the smallest is 8,500, so village P has the lowest number of people watching movies on television.