The diagram below depicts:
2013
The diagram below depicts:
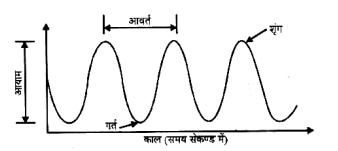
Answer: A. Sound in wave form — The diagram represents a waveform — a graphical plot showing how a quantity (for sound, usually air pressure or particle displacement) varies over time.…
- A.
Sound in wave form
- B.
Wind frequency
- C.
Line of sight
- D.
Compressions on a map
Attempted by 681 students.
Show answer & explanation
Correct answer: A
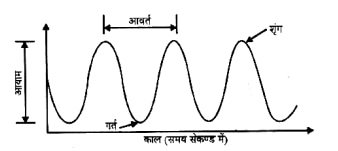
The diagram represents a waveform — a graphical plot showing how a quantity (for sound, usually air pressure or particle displacement) varies over time. Amplitude: Maximum displacement from the equilibrium (vertical axis).
Period: Time (or horizontal distance) between successive similar points on the wave (e.g., crest to crest); frequency is the inverse of period.
Crest: The highest point of the wave.
Trough: The lowest point of the wave.