Directions : Given graph shows the number of orders received and cancelled on…
2019
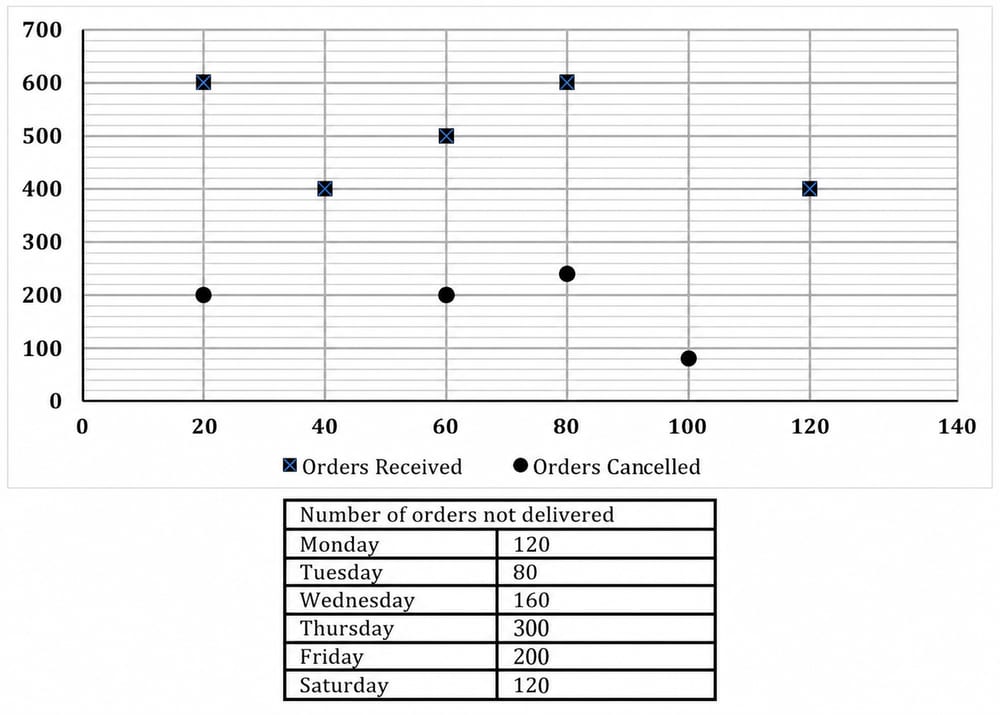
Directions : Given graph shows the number of orders received and cancelled on particular days of a week (From Monday to Saturday) while the table shows the number of orders which were not delivered. Read the data carefully and answer the questions.
(NOTE: Refer Y-Axis values as number of orders while X-Axis values as Days i.e. 20 = Monday, 40 = Tuesday and so on)
(Orders continued/booked are those which are not cancelled)
Some data is missing in the given graph.
Orders Booked = Orders Received – Orders Cancelled
Orders Delivered = Orders Booked – Orders not delivered
if orders booked on Tuesday are 50 more than that of Saturday while the sum of orders cancelled on these days is 30 more than orders not delivered on same days then by what percent orders cancelled on Tuesday are more/less than orders cancelled on Friday?
Answer: B. 12.5% — ConceptIn a data-interpretation set the chain of definitions is fixed: Orders Booked = Orders Received - Orders Cancelled, and Orders Delivered = Orders…
- A.
37.5%
- B.
12.5%
- C.
11.11%
- D.
18.75%
- E.
31.25%
Attempted by 14 students.
Show answer & explanation
Correct answer: B
Concept
In a data-interpretation set the chain of definitions is fixed: Orders Booked = Orders Received - Orders Cancelled, and Orders Delivered = Orders Booked - Orders not delivered. When a value is missing from the chart, do not guess it; set it as an unknown and recover it from the worded conditions, because each condition is one linear equation in those unknowns.
A percentage comparison 'A is what percent more/less than B' is always measured against the REFERENCE quantity B: percent change = (A - B) / B x 100. The base is whatever the value is compared TO, never the value being described.
Setting up the unknowns
Friday's cancelled orders are read directly from the dot graph as 80. Tuesday's cancelled orders are missing, so call them C(Tue); Saturday's cancelled orders are also missing, call them C(Sat). From the graph, Orders Received are 400 on both Tuesday and Saturday.
Applying the two conditions
Booked = Received - Cancelled, so Booked(Tue) = 400 - C(Tue) and Booked(Sat) = 400 - C(Sat).
Condition 1 - 'booked on Tuesday are 50 more than on Saturday': 400 - C(Tue) = (400 - C(Sat)) + 50, which simplifies to C(Sat) = C(Tue) + 50.
Condition 2 - 'sum of orders cancelled on these days is 30 more than orders not delivered on the same days': not-delivered are 80 (Tue) and 120 (Sat), summing to 200, so C(Tue) + C(Sat) = 200 + 30 = 230.
Substitute C(Sat) = C(Tue) + 50 into C(Tue) + C(Sat) = 230: 2 x C(Tue) + 50 = 230, giving 2 x C(Tue) = 180, so C(Tue) = 90 (and C(Sat) = 140).
Required percentage
Tuesday is compared TO Friday, so Friday (80) is the base: percent = (90 - 80) / 80 x 100 = 10 / 80 x 100 = 12.5%. Tuesday's cancelled orders are 12.5% more than Friday's.
Cross-check
With C(Tue) = 90 and C(Sat) = 140: Booked(Tue) = 400 - 90 = 310 and Booked(Sat) = 400 - 140 = 260, and 310 - 260 = 50, matching condition 1; and 90 + 140 = 230 = 200 + 30, matching condition 2. Both worded conditions hold, so the value 90 is consistent.