The table below embodies data on the oil import (in million tonnes) from six…
2020
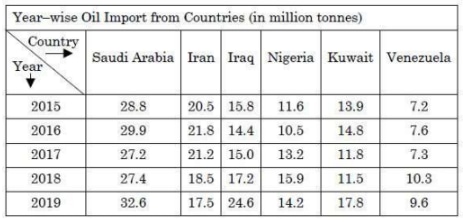
The table below embodies data on the oil import (in million tonnes) from six different countries over the years 2015 to 2019. In accordance with the table, answer the questions
In which of the following years the percentage increase/decrease in oil import from Nigeria over its previous year is the maximum?
Answer: C. 2017 — Nigeria values from the table are: 2015 = 11.6, 2016 = 10.5, 2017 = 13.2, 2018 = 15.9, 2019 = 14.2 million tonnes. Percentage change over the previous year:…
- A.
2016
- B.
2018
- C.
2017
- D.
2019
Attempted by 2 students.
Show answer & explanation
Correct answer: C
Nigeria values from the table are:
2015 = 11.6, 2016 = 10.5, 2017 = 13.2, 2018 = 15.9, 2019 = 14.2 million tonnes.
Percentage change over the previous year:
2016: ((10.5 - 11.6) / 11.6) × 100 = -9.48%
2017: ((13.2 - 10.5) / 10.5) × 100 = 25.71%
2018: ((15.9 - 13.2) / 13.2) × 100 = 20.45%
2019: ((14.2 - 15.9) / 15.9) × 100 = -10.69%
The maximum percentage increase/decrease by magnitude is 25.71%, which occurs in 2017.
Hence, the correct answer is 2017.